Fig. 1.
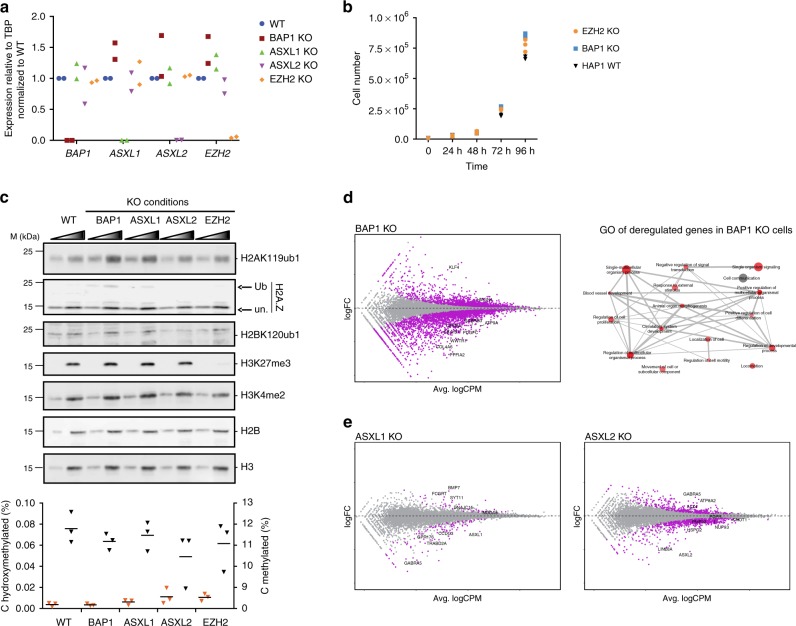
Functional consequences of loss of BAP1, ASXL1, or ASXL2 on chromatin and gene expression. a RT-qPCR analysis of BAP1, ASXL1, ASXL2, and EZH2 expression in the different KO conditions indicated on top. n = 2. b Proliferation curve of wild-type, EZH2 KO and BAP1 KO HAP1 cells. n = 3. c Top, western blot analysis of acid extracted histones with antibodies directed against various histone modifications (as indicated on the right) in the different cell lines indicated on top, M molecular weight. A two-point titration (1:2.5 ratio) is shown for each condition, ub ubiquitinated, un unmodified. Bottom, analysis of cytosine methylation (blue triangles) or hydroxymethylation (red triangles) in the KO conditions indicated at the bottom. Horizontal bars indicate the mean. n = 3. d Left panel: scatterplot showing log2 fold-change (logFC) expression between wild-type and BAP1 KO cells versus average log2 counts per million (logCPM). Differentially expressed genes (DEGs) in BAP1 KO cells are highlighted in purple. Right panel: representation of the non-redundant most enriched GO terms within the DEGs in BAP1 KO cells. e Scatterplots as in d, showing gene expression changes in ASXL1 and ASXL2 KO cells

