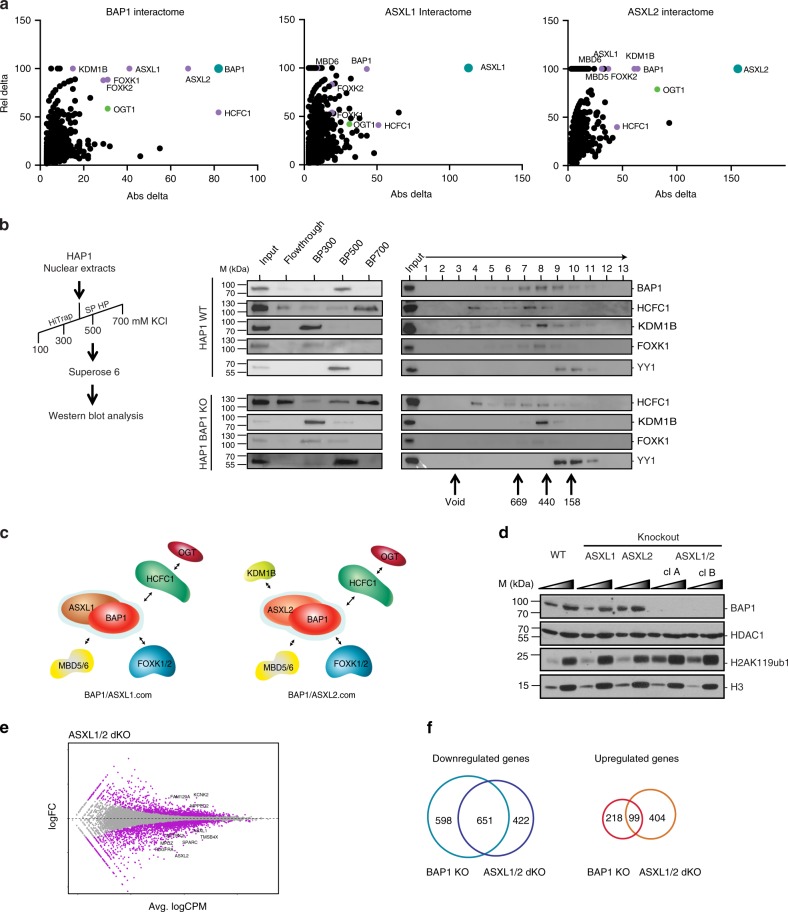
Fig. 2.
BAP1.com core complex and associated factors. a Mass spectrometry analysis of HeLa cells overexpressing Flag-tagged versions of BAP1, ASXL1, and ASXL2. Graphs represent proteins relative to their absolute (Abs) and relative (Rel) delta compared with mass spectrometry analysis of empty vector expressing cells. Absolute delta is the absolute difference between distinct peptides identified in sample and control; relative delta is the ratio of absolute delta versus the sum of distinct peptides identified in sample and control. b Elution patterns of HAP1 WT and HAP1 BAP1-KO nuclear extracts following the purification scheme indicated in the left panel and monitored by western blot with the indicated antibodies. Middle pattern is a representative elution pattern (step elution with increased salt concentration) on a cation exchange column (SP-HP, GE). Right panel is a representative elution pattern on a size-exclusion column (Superose 6, PC3.2/30, GE). Underneath is the correspondent. c Schematic of BAP1.com core complex and associated factors depending on the ASXL paralog present. d Western blot analysis of BAP1 and H2AK119ub1 in the different KO conditions indicated above. Two independent clones of ASXL1/2 dKO cells are shown. HDAC1 and H3 serve as nuclear and histone protein loading control respectively. A two-point titration (1:2.5 ratio) is shown for each condition. e Scatterplot showing log2 fold-change (logFC) expression between wild-type and ASXL1/2 dKO cells as a function of average log2 counts per million (logCPM). Differentially expressed genes in ASXL1/2 dKO cells are highlighted in purple. f Venn diagram showing the overlap between genes downregulated60 or upregulated (right) in BAP1 KO and ASXL1/2 dKO cells

