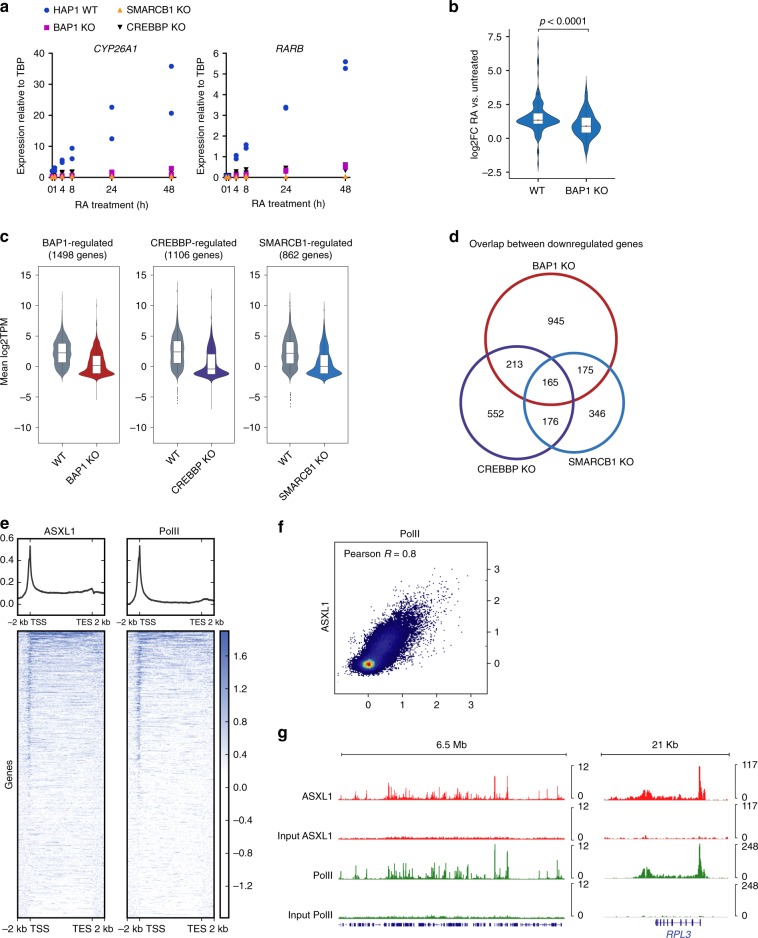
Fig. 5.
Comparison of BAP1 and the CREBBP and SMARCB1 co-activator proteins. a RT-qPCR analysis of CYP26A1 and RARB expression following RA treatment at different time-points in wild-type or BAP1, CREBBP, and SMARCB1 KO cells. n = 2. b Violin plots showing log2 fold-change expression of RA-responsive genes (n = 114 genes, see text for details) in wild-type and BAP1 KO cells. P-value from the Mann–Whitney test is shown. c Violin plots showing log2TPM expression of BAP1- CREBBP-, and SMARCB1-regulated genes in wild-type (WT) or in the respective KO conditions. d Venn diagram showing overlap between genes that are downregulated in BAP1, CREBBP, and SMARCB1 KO cells. e Heatmaps showing ASXL1 and RNA PolII density around the TSS and termination end site (TES) (including 2-kb upstream and downstream) scaled to an equivalent 10 kb in human HEK-293 cells. Corresponding average profiles are plotted above each heatmap. f Scatterplot showing PolII versus ASXL1 enrichment around the TSS (including 2 kb upstream and downstream) at all annotated genes. Pearson correlation coefficient is displayed. g Snapshots of ASXL1 and RNA PolII enrichment at representative regions. The input is displayed below each corresponding ChIP-seq experiment

