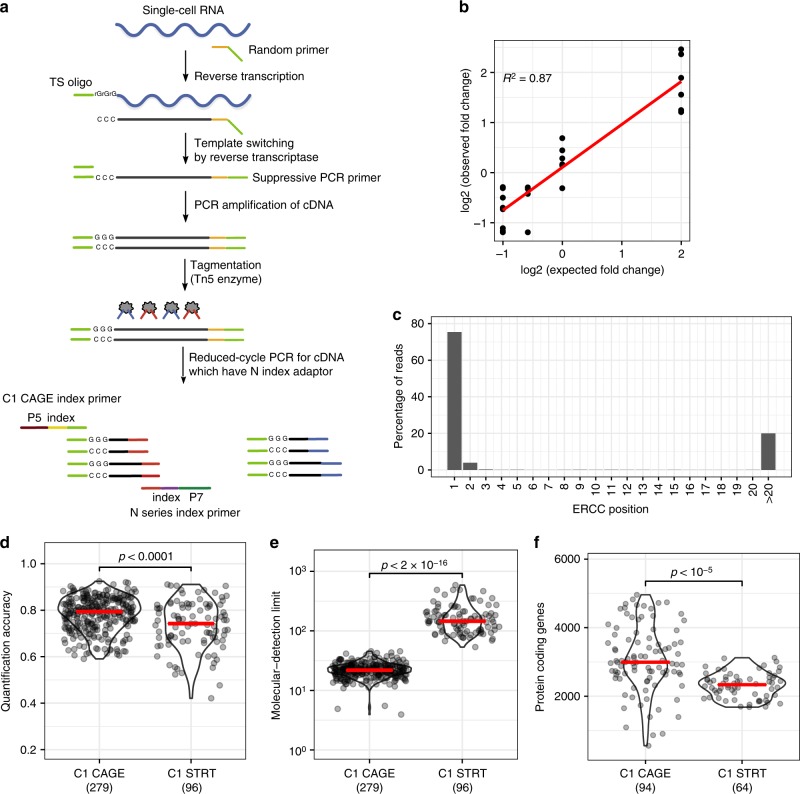
Fig. 1.
The C1 CAGE method and performance. a Schematic of the C1 CAGE method. Tn5 enzymes are loaded with two different adapters: N (red) and S (blue). P5, P7: Illumina sequencing adapters. b Observed and expected fold-change ratios between ERCC mix1 and mix2. Linear regression line (red) and R-squared value shown. c Percentage of reads aligning to the 5ʹ-end of ERCC spike-ins by nucleotide position. d–f Comparison between C1 CAGE and C1 STRT Seq (data from Svensson et al.24) Red bars show median values. p-values from Welch's two-sided two sample t test shown. d Pearson correlation between expected and observed ERCC spike-in molecules. e The number of ERCC spike-in molecules required for a 50% chance of detection. f Protein-coding genes detected in mouse ES cells counting reads within FANTOM5 promoter regions. Source data are provided as a Source Data file

