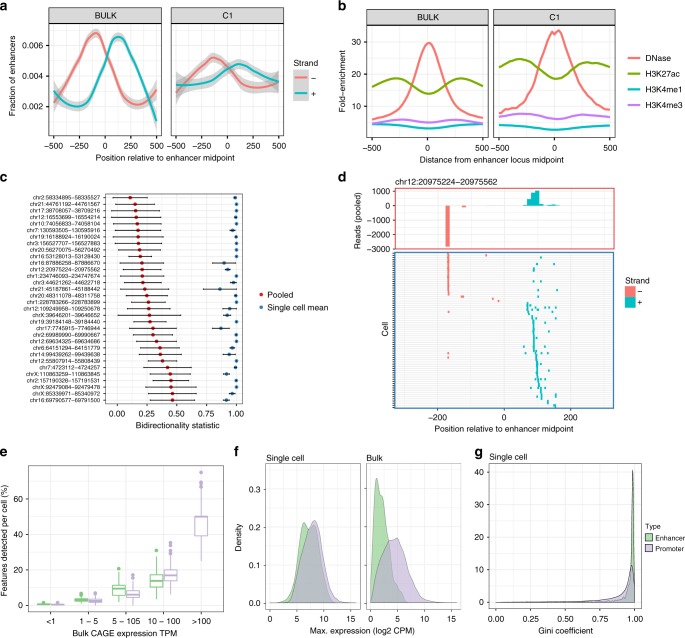
Fig. 4.
Enhancer analysis at single-cell resolution. Comparison of enhancers detected by bulk CAGE and pooled C1 CAGE data a showing bidirectional read profiles smoothed by generalized additive model and b epigenetic profiles. c Bidirectionality scores (0: equally bidirectional; 1: fully unidirectional) at selected enhancers for pooled cells downsampled to the same depth as corresponding single cells 100 times (red dots: mean, black bars: standard error) and single-cells (blue dots: mean; black bars: standard error). d Example locus on chromosome 12: read profile histogram (upper box), and read presence or absence in single-cells (lower box). e–g Comparison of enhancers and gene promoters in C1 CAGE and bulk CAGE: e fraction of bulk features detected within each cell, stratified by bulk expression level, centre line = median, box = 25th to 75th percentiles, whiskers = up to 1.5× interquartile range from the box. f Density plots of the maximum expression levels, g Gini coefficient distribution in single-cell data. Lower scores: broad expression (expressed in more cells); higher scores: more specific/enriched expression (fewer cells). Source data are provided as a Source Data file

