Fig. 5.
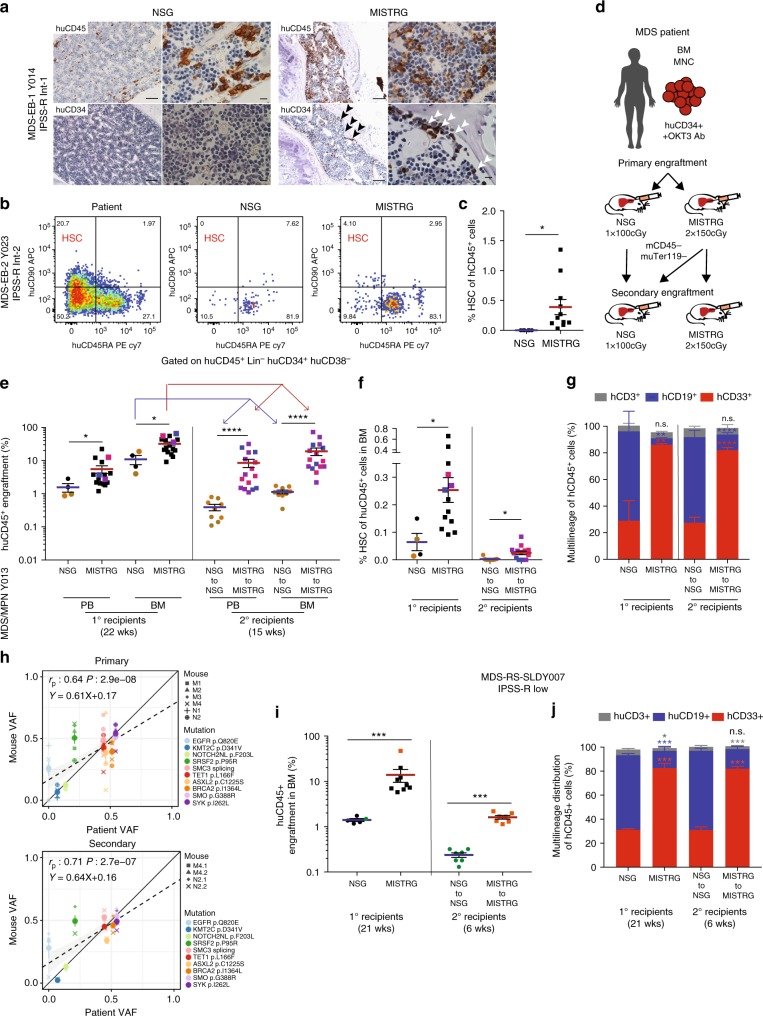
MISTRG support phenotypic and functional clonal myelodysplastic syndrome (MDS) stem cells with long-term multi-lineage engraftment potential in serial transplantation. a Representative immunohistochemistry (IHC) for huCD45 and huCD34 distribution in NSG (of n = 5) and MISTRG (of n = 12) bone marrow (BM) engrafted with MDS-EB-1 (Y014; scale bars for low-power field: 100 µm, original magnification 10×; high-power field: 10 µm, original magnification 60×). b, c MISTRG engraft phenotypic MDS stem cells. b Representative fluorescence-activated cell sorting (FACS) plots and c quantification of hematopoietic stem cell (HSC) representation (lin−CD34+CD38−CD45RA−CD90+ of huCD45+) of corresponding patient (high-risk MDS-EB2, Y023), and NSG and MISTRG xenografts. d–j MISTRG engraft functional MDS stem cells. d Secondary xenotransplantation experimental setup. e–h Primary and secondary transplantation of MPN/MDS sample with 3% blasts (Y013) comparing e overall huCD45+ engraftment in peripheral blood (PB) and BM, f phenotypic HSC % in BM, and g relative distribution of myeloid CD33+ (red), B-lymphoid CD19+ (blue), and T-lymphoid CD3+ (gray) cells as % of human CD45+ cells in NSG vs. MISTRG mice. In scatter plots individual mice are represented by symbols with means ± S.E.M.; symbols for corresponding 1° and 2° recipient mice are color coded; statistics represent Mann–Whitney test; n.s. not significant, *p < 0.05, **p < 0.01, ***p < 0.001, ****p < 0.0001. Stacked bar graphs represent means ± S.E.M. Mann–Whitney test; n.s. not significant, *p < 0.05, **p < 0.01, ***p < 0.001, ****p < 0.0001. h Clonality was determined in representative primary and secondary MISTRG recipients with engraftment levels >1% via targeted exome sequencing. Variant allele frequencies (VAFs) in primary and secondary recipients were plotted against the corresponding patient’s. Individual mice are represented by symbol shape and mutations are color coded. Linear regression, Pearson's correlations, and p values between patient and xenograft VAF are displayed. i, j Primary and secondary transplantation of a low-risk MDS-RS-SLD sample (Y007) comparing i overall engraftment in PB and BM and j multi-lineage representation in BM of primary and secondary NSG and MISTRG recipients. Individual mice are represented by symbols with means ± S.E.M.; symbols for corresponding 1° and 2° recipient mice are color coded; statistics represent Mann–Whitney test; n.s. not significant, *p < 0.05, **p < 0.01, ***p < 0.001, ****p < 0.0001. For patient information see Supplementary Table 1

