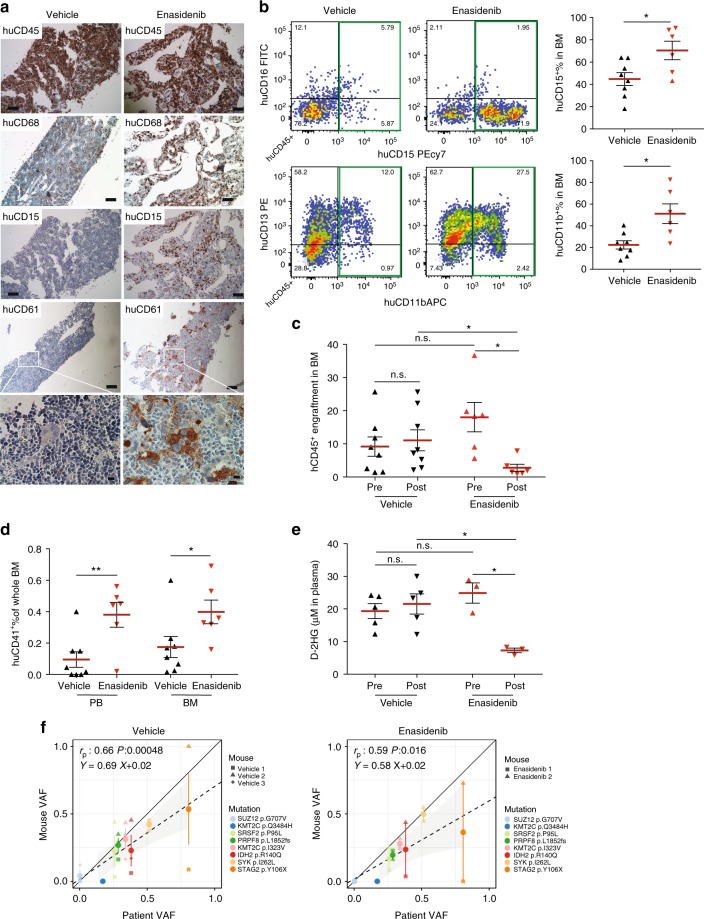
Fig. 6.
MISTRG replicate granulocytic and megakaryocytic differentiation in response to inhibition of mutant isocitrate dehydrogenase 2 (IDH2) in vivo. a In vivo treatment of mutant IDH2 R140Q in MDS-EB-2 (Y021)-engrafted MISTRG mice with the IDH2MUT inhibitor enasidenib. Representative histologic images of vehicle-treated (n = 8, left) and enasidenib-treated (n = 6, right) mice engrafted with MDS-EB-2 (Y021). Immunohistochemistry (IHC) stains for huCD45, huCD68, huCD15, and huCD61 (scale bars 100 µm, original magnification 10×; high-power field 10 µm, original magnification 60×). b Representative fluorescence-activated cell sorting (FACS) plots showing myeloid maturation in response to enasidenib and quantitation of huCD15+ and huCD11b+ expression in vehicle- versus enasidenib-treated MISTRG mice. c Comparison of human engraftment in bone marrow (BM) from vehicle-treated (n = 8) and enasidenib-treated (n = 6) MISTRG mice. d Quantitation of huCD41+ expression in peripheral blood (PB) and BM from vehicle-treated (n = 8) and enasidenib-treated (n = 6) MISTRG mice. e Quantitation of D-2-HG in plasma of pre- and post-administration of vehicle or enasidenib. Individual mice are represented by symbols with mean ± S.E.M.; statistics represent Mann–Whitney test; n.s. not significant, *p < 0.05, **p < 0.01 for aggregate NSG vs. MISTRG. f Representation of variant allele frequencies (VAFs) of driver mutations in vehicle-treated (left) or enasidenib-treated (right) MISTRG (y-axis) plotted against the patient’s VAFs (x-axis). Individual mice represented by symbol shape, mutations color coded. Linear regressors, Pearson's correlations, and p values between patient and xenograft VAFs are displayed

