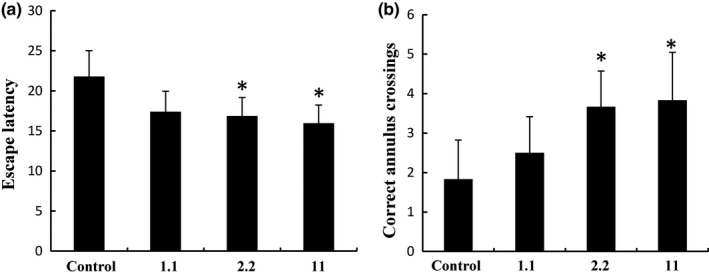
Figure 1.

Latency in the Morris water maze hidden platform task, target quadrant time ratios, and correct number of annulus crossings. (a) Comparison of latency times between control, 1.1, 2.2, and 11 g kg−1 day−1 groups. (b) Correct number of annulus crossings between the control group and the walnut oil‐treated groups in the probe trials of the Morris water maze task. Data are presented as mean±SD. *p < 0.05, compared with the control group
