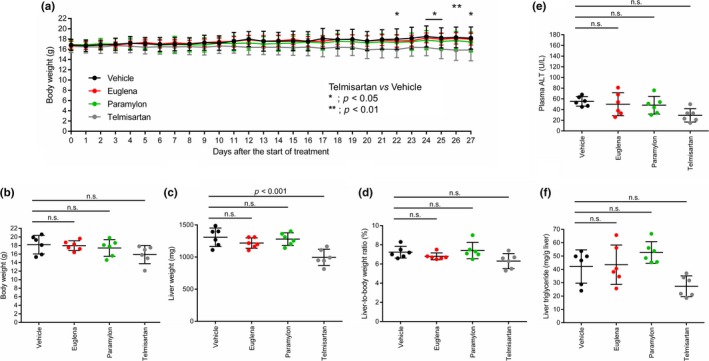
Figure 2.

General findings in STAM mice administered test substances. Comparison of (a) body weight change, (b) body weight, (c) liver weight, (d) liver‐to‐body weight ratio, (e) plasma ALT, and (f) liver triglycerides in each group. Vehicle (black), Euglena (red), paramylon (green), telmisartan (gray). Asterisks indicate statistical significances (p < 0.01 or p < 0.05), while n.s. indicates “not significant”
