Figure 9.

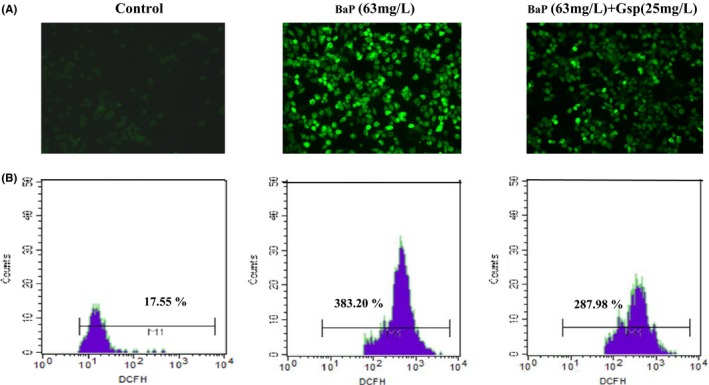
Effects of Gsp on reactive oxygen species (ROS) in BaP‐treated HL‐7702 cells. ROS levels were measured by fluorescent microscope (A) and flow cytometry (B) after incubation with DCFH‐DA. Scale bar = 100 μm

Effects of Gsp on reactive oxygen species (ROS) in BaP‐treated HL‐7702 cells. ROS levels were measured by fluorescent microscope (A) and flow cytometry (B) after incubation with DCFH‐DA. Scale bar = 100 μm