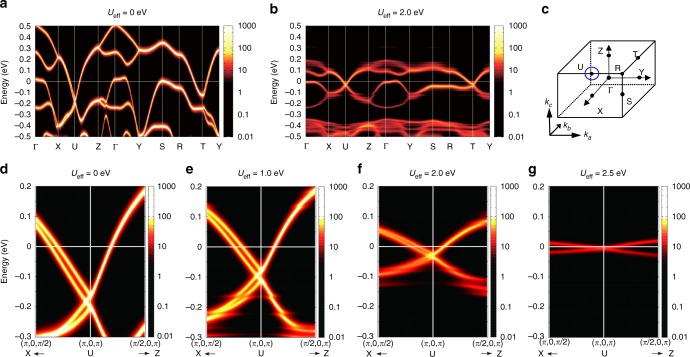
Fig. 3.
Band structure calculated by density functional theory and dynamical mean field theory. a, b Overview of band structure with the Hubbard Ueff = 0 and 2.0 eV. The scale bar denotes the magnitude of spectral function. c Illustration of momentum space and position of Dirac line node (blue line). d–g The magnified view of band structure around the Dirac line node with different Ueff. The Dirac line node approaches the Fermi energy with increasing Ueff. The Dirac-like dispersion is significantly renormalized for Ueff = 2.5 eV, which is a precursory phenomenon of the Mott criticality. The averaged Fermi velocity is 2.0 × 10⁵, 1.8 × 10⁵, 8.1 × 10⁴, and 2.0 × 10⁴m s−1 at Ueff = 0, 1.0, 2.0, and 2.5 eV, respectively

