Fig. 1.
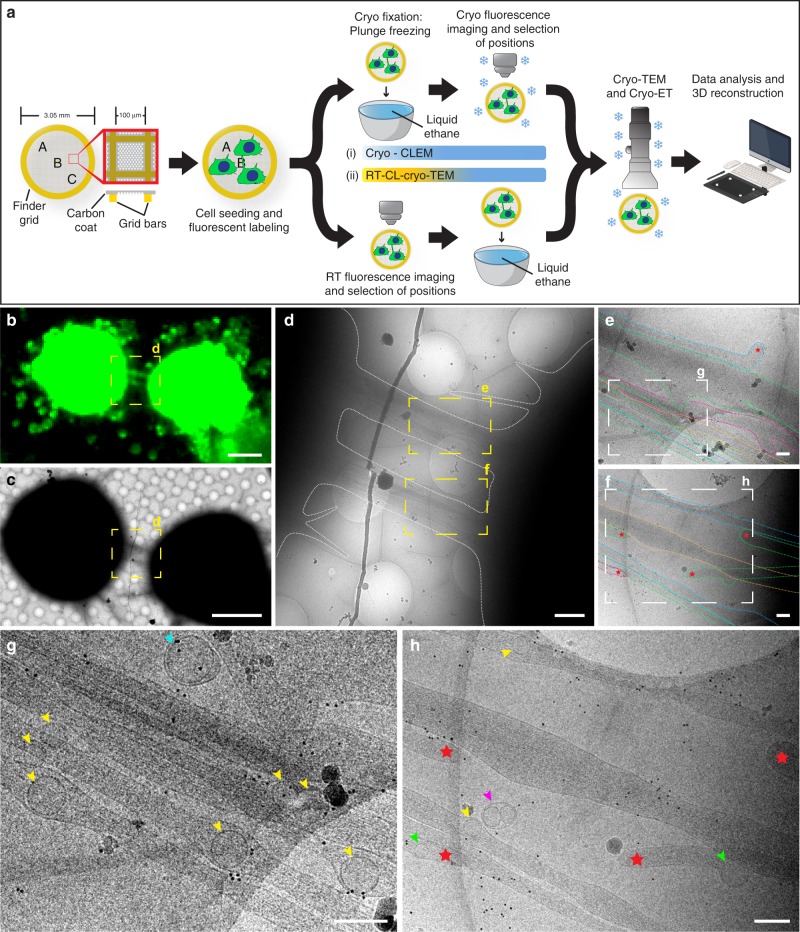
Correlated light and cryo-electron microscopy strategies reveal individual TNTs. a A schematic diagram of the experimental workflow and approaches used to observe TNT-connected CAD cells by cryo-TEM. b Cryo-FM image of two CAD cells connected by a TNT stained with WGA (green). c Cells in b observed in cryo-TEM at low magnification. Yellow dashed squares in b, c are shown at intermediate magnification in d. Yellow dashed rectangles in d are shown at high magnification in e and f, respectively. The plasma membrane of individual TNTs (iTNTs) were drawn with dotted colored lines in e and f to show membrane boundaries. Enlargements of white dashed rectangles in e and f are shown in g and h, respectively. g, h Various vesicular compartments were observed within and between iTNTs: yellow arrowheads show single vesicles; pink arrowheads show vesicles surrounded by an outer membrane; turquoise arrowheads show vesicles enclosed by a double membrane. Red stars in e, f, and h show tips of iTNTs extending/retracting from neighboring cells. Green arrows indicate vesicles inside extending/retracting iTNT tips observed in h. Scale bars: b, c, 10 μm; d, 1 μm; e–h, 200 nm

