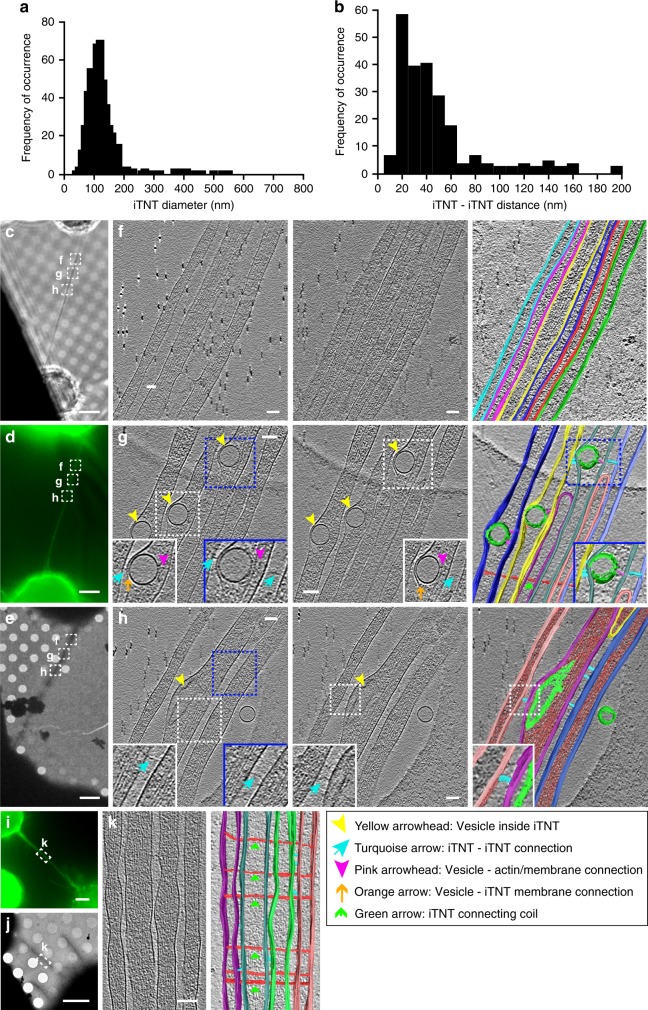
Fig. 2.
Imaging iTNTs in 3D using correlated light and cryo-electron tomography. a iTNT diameter distribution in nm. b Distribution of the distance between parallel and non-parallel iTNTs in nm. CAD cells connected by a TNT stained with WGA (green) imaged by phase contrast (c), epifluorescence (d), and low-magnification TEM (e). Dashed squares over the TNT in c–e, denoted f–h, correspond to non-consecutive high-magnification cryo-ET slices (f–h, left, middle, and Supplementary Movies 1–3). f–h (right) Rendering of tomograms (Supplementary Movies 1–3, respectively). Turquoise arrows in g and h, left, middle show filaments connecting iTNTs. Vesicles within iTNTs (yellow arrowheads, g and h, left, middle) use thin filaments to connect to the plasma membrane on one side (orange arrows, g left, middle) and actin on the other (pink arrowheads, g left, middle). Additional example of cells connected by a TNT is shown in i (epifluorescence) and j (low-magnification TEM). Region denoted by a white dashed rectangle in i–j is shown at high-magnification cryo-TEM in k left. k right, rendering of k, left (Supplementary Movie 5). Thin filaments connect the bundle of iTNTs by coiling around them (green arrows, g and k (rendering)). Source data for a, b are provided as a Source Data file. Scale bars: c–e, i–j, 5 μm; f–h, k, 100 nm

