Fig. 4.
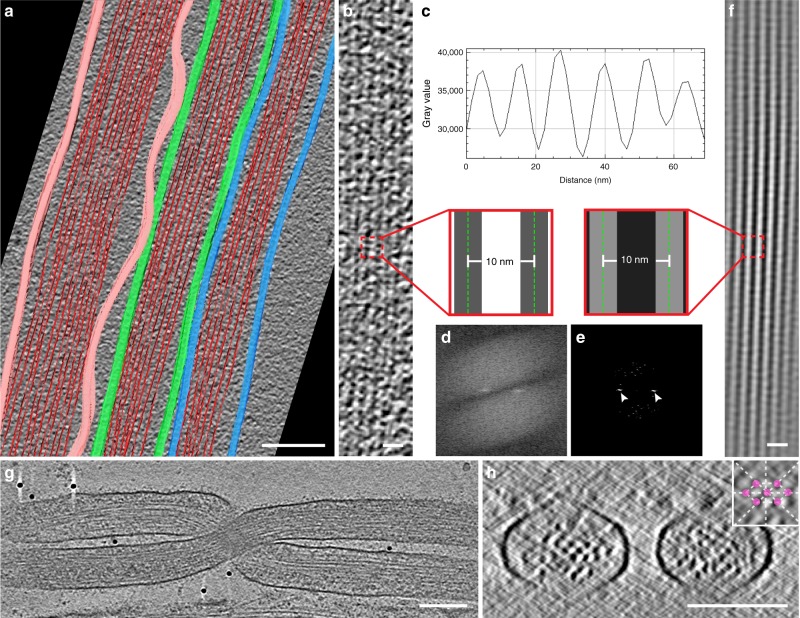
Cryo-electron tomography reveal F-actin organization in iTNTs. a Segmentation rendering obtained from a tomogram showing iTNTs (Supplementary Movie 8). The average size and spacing between filaments of an iTNT shown in b were measured by computing the plot profile of actin bundles residing within. c–e Filament-to-filament distance measured by extracting peaks in the frequency domain using the fast Fourier transform (white arrowheads, e) and by computing plot profiles (c). f Model of the actin filaments displaying a parallel bundle in iTNTs obtained by retransforming peaks in the frequency domain shown in e. Insets in b and f show distances between the average measurements in nm obtained by the analysis shown in c and d. g High-magnification cryo-tomogram slice of two iTNTs (Fig. 3b and Supplementary Movie 4). h Cross-section of the cryo-electron tomogram in g displaying the actin arrangement within two iTNTs. Scale bars: a, 100 nm; b, f, 20 nm; g, h, 100 nm

