Fig. 6.
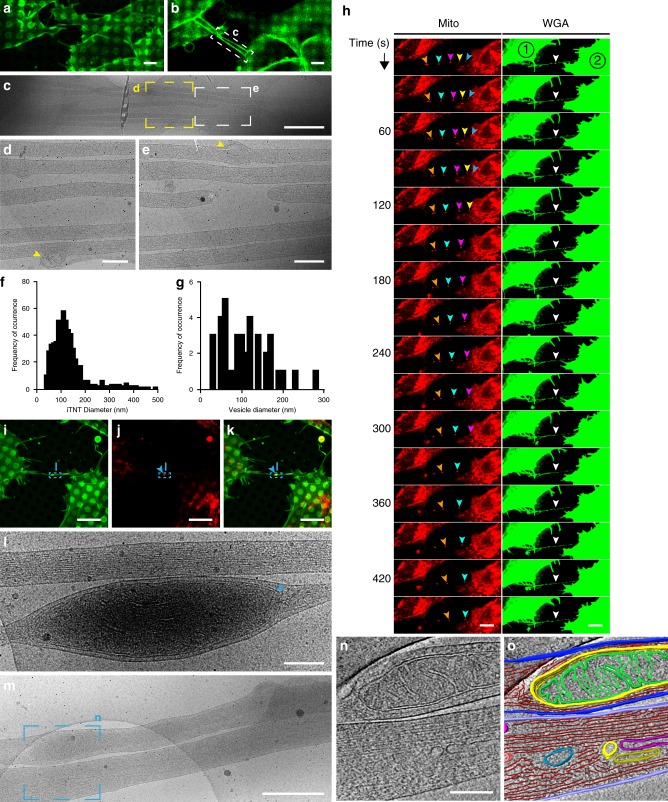
Structural analysis and live imaging reveal mitochondrial transport via iTNTs. a Confocal micrograph of SH-SY5Y cells stained with WGA (green). a Lower and b upper optical slices show TNTs hovering over the substrate. c Low-magnification electron micrograph corresponding to white dashed rectangle in b. d–e High-magnification micrographs corresponding to yellow and white dashed squares in c. Yellow arrowheads indicate membranous compartments inside iTNTs. f–g Diameter distribution of iTNTs (f) and vesicles found within them (g) in nm. h Time-lapse sequence of two SH-SY5Y cells stained with WGA (green) and MitoTracker (red) reveal mitochondrial puncta (orange, cyan, pink, yellow, and blue arrowheads) traveling across a TNT (white arrowhead) entering the apposing cell, (cell #2). i–k SH-SY5Y cells stained with WGA (green) and mitotracker (red), (blue arrowheads indicate mitochondria inside the TNT). l Micrograph corresponding to blue dashed rectangles in i–k reveal mitochondria (blue arrowhead) observed by fluorescence (i–k). m Micrograph displays two iTNTs, one containing mitochondria. n Tomogram slice corresponding to m (blue dashed square) reveal mitochondrial cristae, actin, and membranous compartments found inside iTNTs. o Rendering of n. Source data for f–g are provided as a Source Data file. Scale bars: a–b, 5 μm; c, 1 μm; d, e, l, n, 200 nm, h–i, 10 μm; m, 500 nm

