Fig. 7.
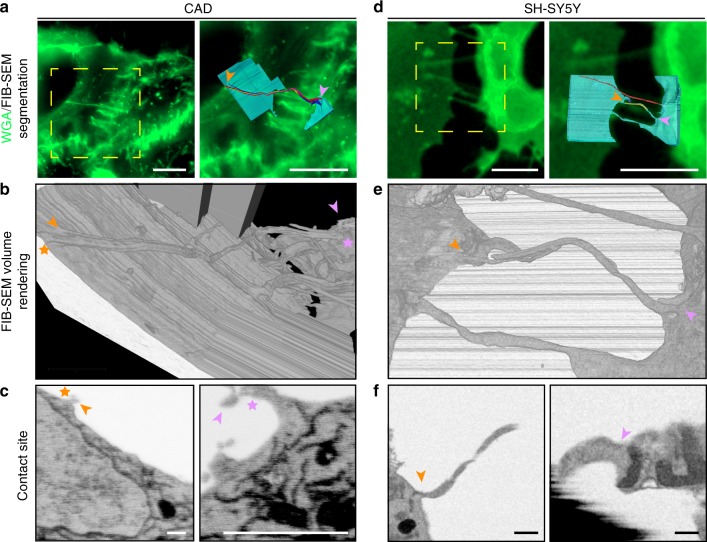
FIB-SEM of TNTs in CAD and SH-SY5Y cells open-open contact sites. a, d Confocal micrographs of TNT-connected CAD (a) and SH-SY5Y (d) cells stained with WGA (green). Yellow dashed boxes in a and d (left) show the regions of interest chosen for FIB-SEM volume acquisition. A magnified view of these regions is shown in a and d (right) overlaid with their FIB-SEM segmented rendering counterpart. Segmented cell bodies and single open-ended connections are shown in cyan. Open-ended iTNTs are shown in blue, yellow, and magenta. Single close-ended protrusions are shown in red. Orange and pink arrowheads indicate contact sites with cells. b, e Renderings of FIB-SEM volumes produced by the Amira software are shown for CAD (b) and SH-SY5Y (e) cells. c, f Single frames obtained from the raw FIB-SEM data of CAD cells (c), obtained at a pixel size of 2.5 nm and displayed in an x-y orientation, and SH-SY5Y cells (f) obtained at a pixel size of 10 nm and displayed in an x-z orientation. Panels show TNT-to-cell contact sites at both ends of the connection: orange arrowhead (left); pink arrowhead (right). Scale bars: a, d, 10 μm; c, f, 500 nm

