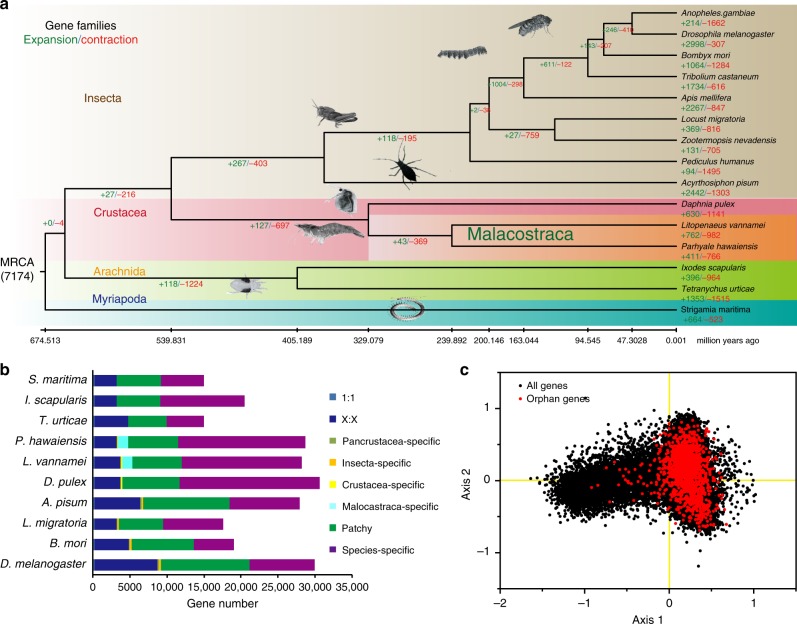
Fig. 2.
Comparative genomics analysis of L. vannamei and other arthropods. a Phylogenetic placement of L. vannamei in the arthropod phylogenetic tree. Numbers on branches indicate the number of gene gains (+) or losses (−). The estimated divergence times are displayed below the phylogenetic tree. Image credits: Gewin V, Martin Cooper, Bernard Dupont, Carlo Brena, Gilles San Martin, David Ludwig, S. Rae. b Comparison of the gene repertoire of ten arthropod genomes. “1:1” indicates single-copy genes, “X:X” indicates orthologous genes present in multiple copies in all the ten species, where X means one or more orthologs per species, “patchy” indicates the existence of other orthologs that are presented in at least one genome. c Principal component analysis (PCA) on relative codon usage of orphan genes

