FIGURE 6.
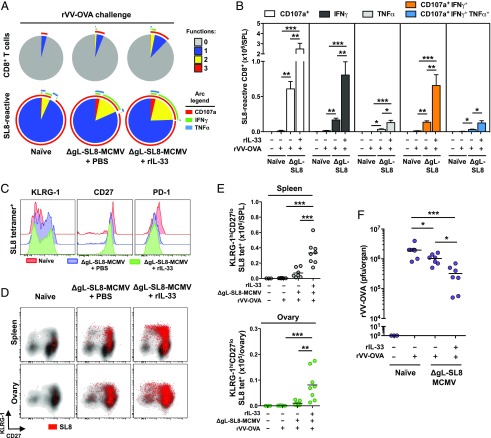
Exogenous IL-33 augments the protective efficacy of ΔgL-SL8-MCMV. Female C57BL/6 mice were infected with ΔgL-SL8-MCMV alongside a single dose of rIL-33 (2 μg) or volume-equivalent PBS and challenged with rVV-OVA on day 92 postinfection (pi) as depicted in Fig. 5A. (A) Functional profiles of CD8+ T cells specific for SL8 were characterized among leukocytes isolated from spleens on day 5 postchallenge (day 97 pi). Combination gates were exported into Simplified Presentation of Incredibly Complex Evaluations (SPICE) software (https://niaid.github.io/spice/). Pie chart segments represent the fraction of cells expressing the number of functions indicated in the key. Arcs denote individual functions (CD107, IFN-γ, and TNF-α). Concatenated data are shown (n = 3–8 mice per group). (B) Total numbers of monofunctional (CD107a+, IFN-γ+, or TNF-α+) and polyfunctional (CD107a+IFN-γ+ or CD107a+IFN-γ+TNF-α+) CD8+ T cells specific for SL8 were quantified among leukocytes isolated from spleens on day 5 postchallenge (day 97 pi). Data are shown as mean ± SEM (n = 3–8 mice per group). (C) Expression levels of KLRG-1, CD27, and PD-1 were quantified on tetramer-binding CD8+ T cells specific for SL8 among leukocytes isolated from spleens on day 5 postchallenge (day 97 pi). Representative overlay histograms are shown. (D) Expression levels of KLRG-1 and CD27 were quantified on tetramer-binding CD8+ T cells specific for SL8 among leukocytes isolated from spleens and ovaries on day 5 postchallenge (day 97 pi). Representative flow cytometry plots are shown. Ag-specific events are depicted as colored dots superimposed on black density plots encompassing all CD8+ T cells. (E) Total numbers of KLRG-1hiCD27lo tetramer-binding CD8+ T cells specific for SL8 were quantified among leukocytes isolated from spleens and ovaries on day 5 postchallenge (day 97 pi). Data are shown as mean ± SEM (n = 3–8 mice per group). (F) Replicating rVV-OVA titers were quantified in ovaries isolated on day 5 postchallenge (day 97 pi). Horizontal bars depict median PFU per organ (n = 3–8 mice per group). Results are concatenated from two independent experiments (A, B, E, and F). *p ≤ 0.05, **p ≤ 0.01, ***p ≤ 0.001.

