
Figure 2.
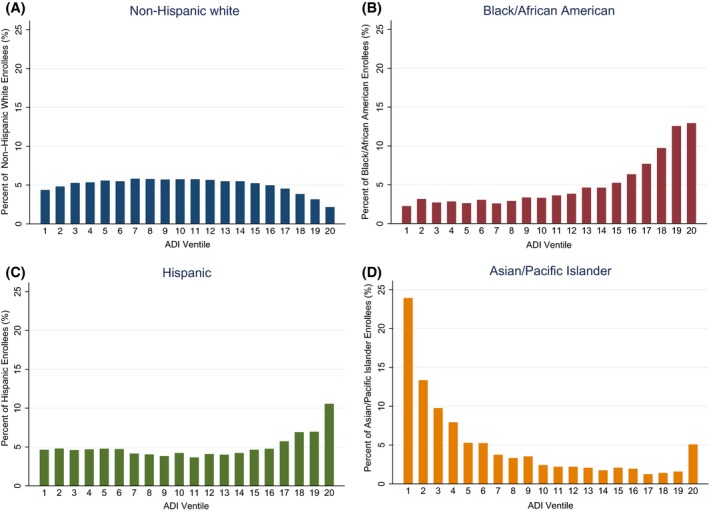
Number of white, black, hispanic, and asian enrollees in each ventile of neighborhood deprivation for blood pressure control† [Color figure can be viewed at http://www.wileyonlinelibrary.com/]
- Notes. †Neighborhood deprivation is derived from the Area Deprivation Index score, which was split into 20 equally sized ventiles, representing increasing (worsening) neighborhood deprivation in 5 percent increments. Results not shown for diabetes and cholesterol control cohorts.