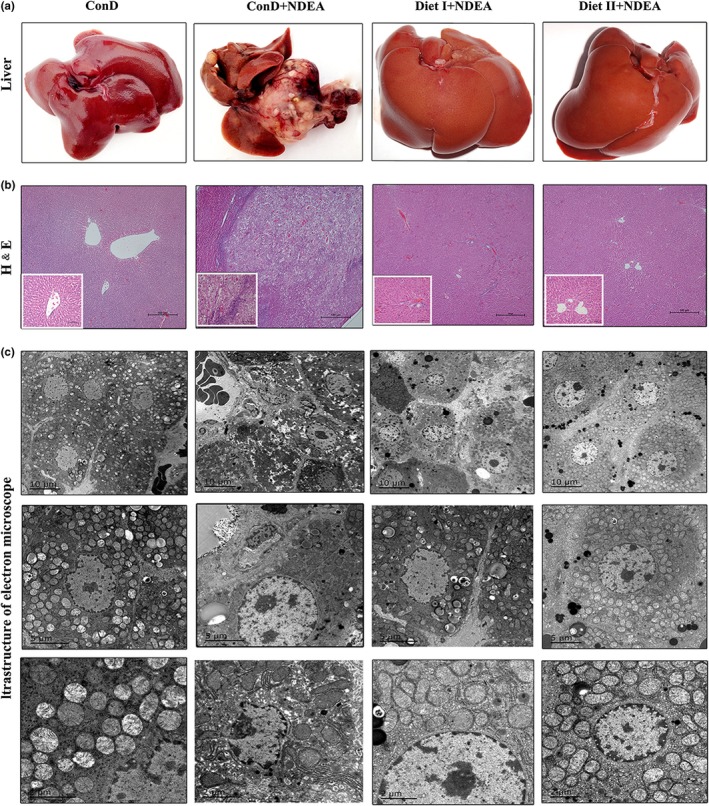
Figure 1.

Effects of Diet I and Diet II on liver tissue pathological changes in NDEA‐induced hepatocarcinogenesis rats. (a) Representative images of the livers from each group rats. (b) Representative liver histopathological changes using hematoxylin and eosin (H&E) staining of rats are shown as ×40 magnifications (big figure) and ×200 magnifications (small figure). (c) Representative transmission electron microscope (EM 2000) images of changes in the ultrastructure of hepatic cells in rats. ConD: normal control group; ConD+NDEA: model group, NDEA plus control diet‐treated group; Diet I+NDEA: NDEA plus Diet I‐treated group; Diet II+NDEA: NDEA plus Diet II‐treated group. ConD: control diet; NDEA: N‐nitrosodiethylamine
