
Figure 1.
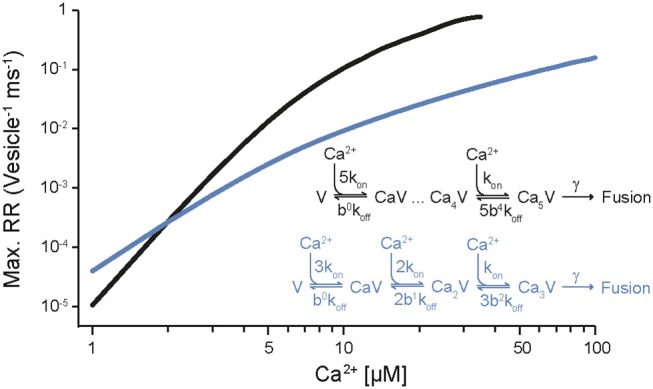
Dependency of release rates on the intracellular Ca2+ concentration. Release rates were calculated for different [Ca2+]i using the sensor models developed for Syt2 at the calyx of Held (black; Schneggenburger and Neher, 2000) and for Syt1 at chromaffin cells (blue; Voets, 2000). Peak release rates per vesicle were plotted against the corresponding [Ca2+]i. Insets show the kinetic binding schemes for the reaction between vesicular sensor (V) and Ca2+.