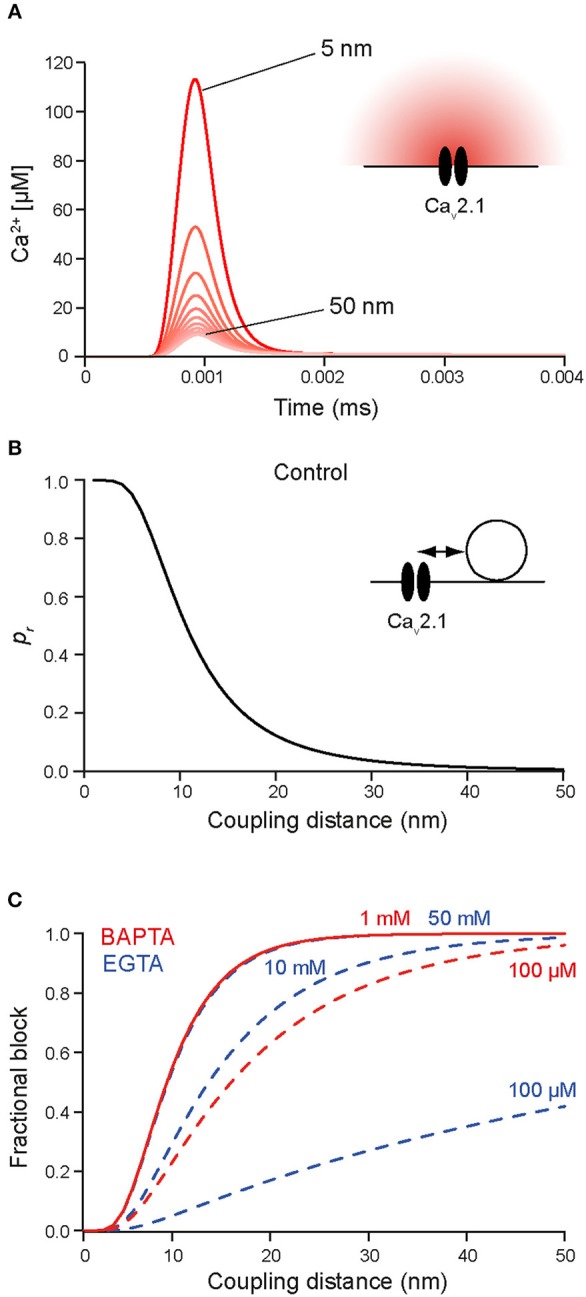
Figure 3.

(A) Simulated [Ca2+]i transients at increasing distances between 5 and 50 nm (5 nm increments) from a single Cav2.1 channel (inset; Li et al., 2007) opening during an AP in the absence of Ca2+ buffers. (B) Release rates were simulated at increasing distances from the Cav2.1 channel (1 nm increments) using the Syt2 sensor model from Figure 1. Release probabilities were calculated by integrating the release rates over time and plotted against the corresponding sensor-to-Cav coupling distances. Note the steep decline in pr between 6 and 20 nm coupling distance and that pr at 50 nm is almost 0. (C) Simulated relative reduction of pr for different concentrations of EGTA (blue) and BAPTA (red). Moderate concentrations of EGTA are not very effective in blocking release close to a channel, while moderate concentrations of BAPTA are highly effective already at coupling distances of 10–20 nm. Higher concentration of EGTA mimic the effects of lower concentrations of BAPTA (concentrations are indicated). Note that in native boutons the concentrations of EGTA and BAPTA that yield corresponding effects on pr will be different due to the presence of native Ca2+-binding proteins, which were not included in the simulations.
