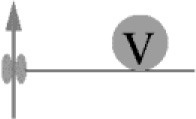
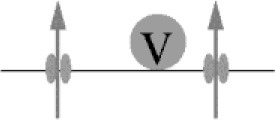
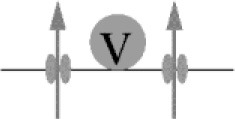
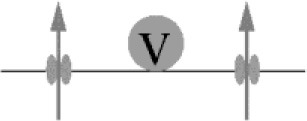
Table 3.
Active zone topographies.
| AZ topgraphy | Release | Chelators | Submaximal Cd2+ block | Full subtype block | References | |
|---|---|---|---|---|---|---|
| SINGLE-DOMAIN TOPOGRAPHY (NO DOMAIN-OVERLAP) | ||||||
 |
homog. tight coupling all pr identical = nanodomain |
pr, avg = 1/N∑pr = pr |
BAPTA >> EGTA DE: Monophasic | PPR→ | RRtotal = RRP/Q + RRN | Bucurenciu et al., 2008; Baur et al., 2015; Kusch et al., 2018 |
 |
homog. loose coupling all pr identical | Ditto | BAPTA ≥ EGTA DE: Monophasic | Ditto | Ditto | Only simulation |
 |
heterog. coupling heterog. pr |
pr, avg = 1/(N1 + N2)(∑pr, 1 + ∑pr, 2) Psyn = 1−F |
BAPTA ≥ EGTA DE: Biphasic | Ditto | Ditto | Scimemi and Diamond, 2012; Ritzau-Jost et al., 2018 |
| DOMAIN-OVERLAP TOPOGRAPHY | ||||||
 |
heterog coupling homog. pr | Catotal = Ca1 + Ca2 Catotal → pr | BAPTA ≥ EGTA DE: Monophasic | PPR↗ | RRtotal < RRP/Q + RRN | Ermolyuk et al., 2013 |
 |
homog. tight coupling homog.pr | Catotal = nCa Catotal → pr | BAPTA >> EGTA DE: Monophasic | Ditto | Ditto | Nakamura et al., 2015 |
 |
homog. loose coupling homog. pr = microdomain | Ditto | BAPTA ≥ EGTA DE: Monophasic | Ditto | Ditto | Vyleta and Jonas, 2014; Baur et al., 2015; Nakamura et al., 2015; Kusch et al., 2018 |
pr, release probability of a vesicle; N, number of vesicles (or release sites that can release a max. of one vesicle), pr,avg, average release probabilities across vesicles; Psyn, synaptic release probability, Fsyn, synaptic failure rate; DE, EGTA dose effect curve; PRR, paired-pulse ratio; RR, release rate.
