Figure 1.
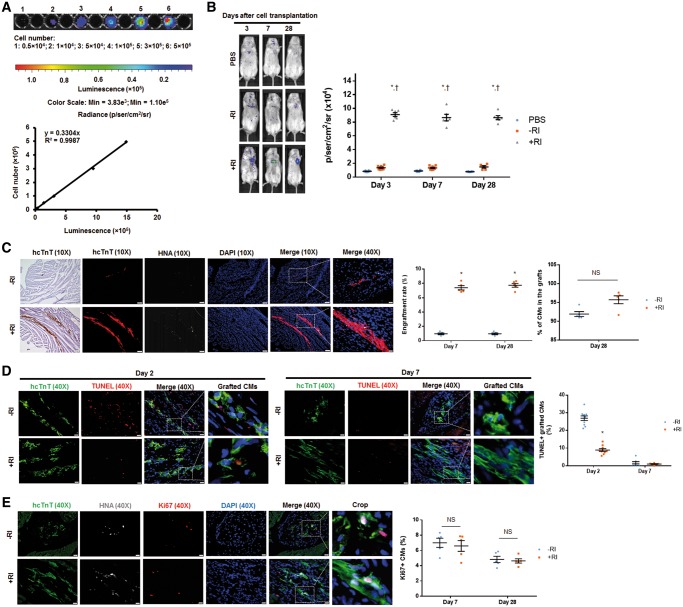
Y-27632 preconditioning improves engraftment rate of hiPSC-CMs transplanted into hearts of MI mice. Since transplanted cells carried a plasmid vector encoding a firefly luciferase reporter and were of human origin, the engraftment was evaluated via BLI and by identifying grafted cells that expressed the hcTnT and HNA. (A) A standard curve was generated from BLI measurements of various known hiPSC-CM cell numbers seeded on a plate. (B) Luciferin signal was higher in mice treated with hiPSC-CM+RI than those treated with PBS or hiPSC-CM−RI on Days 3, 7, and 28 after surgery. n = 6–9 mice per group. *P < 0.05 vs. PBS group; †P < 0.05 vs. hiPSC-CM−RI group. (C) Heart sections from mice, sacrificed on Days 7 and 28 after surgery, were stained for hcTnT and HNA. Engraftment size was higher in mice receiving hiPSC-CM+RI than those receiving hiPSC-CM−RI on both Days 7 and 28 after surgery. Heart sections were stained with wheat germ agglutinin to define the cell border and with antibodies against HNA and hcTnT. The proportion of HNA-positive cells that also co-expressed hcTnT was determined and expressed as a percentage. (C) Images were obtained from animals on Day 28 after surgery. For 10X images: bar = 100 μm; for 40X images: bar = 20 μm. n = 5 mice per group; 32–40 sections per mice were evaluated. *P < 0.05 vs. hiPSC-CM−RI group; unpaired Student’s t-test was performed. (D–E) Cells undergoing apoptosis were identified by TUNEL staining. Cells with active cell cycle were identified by immunostaining for Ki67. The percentage of TUNEL+/hcTnT+ hiPSC-CMs (D) and Ki67+ hiPSC-CMs (E) was calculated. (E) Images were taken on Day 28 after surgery. (D and E) Bar = 20 μm. n = 4–6 mice per group; four sections per mice were evaluated. *P < 0.05 vs. hiPSC-CM−RI group. One-way ANOVA analysis with Bonferroni correction was performed (B). Unpaired Student’s t-test was performed (C–E). Data were presented as the mean ± SEM.

