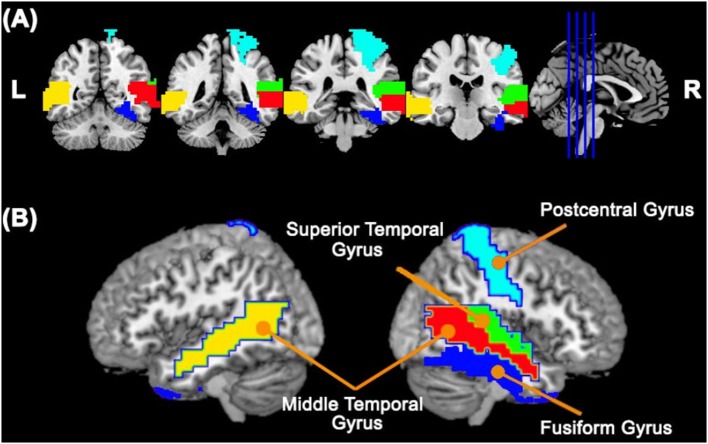
Figure 1.
Cortical ROIs with a differential association with the cerebellum between TD and ASD groups obtained by analyzing the ABIDE I dataset. Panels (A,B) represent coronal slices and two lateral views of the brain, respectively. The colors represent the cortical ROIs that differentially associated with the cerebellum between TD and ASD groups, namely, the right fusiform gyrus, right postcentral gyrus, right superior temporal gyrus, right middle temporal gyrus, and left middle temporal gyrus.

