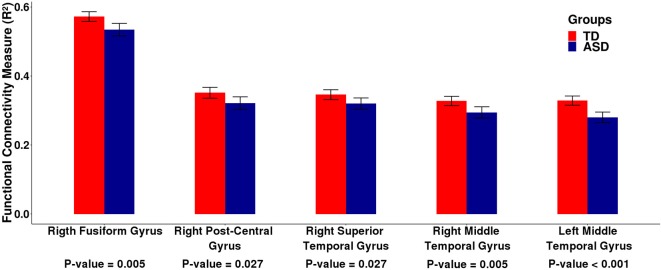
Figure 2.
Barplots of the functional connectivity measure (R2) between the cortical ROI and the cerebellum obtained by analyzing the ABIDE I dataset. Each pair of bars represent the mean functional connectivity measurements between the cortical ROI and the cerebellum for the TD and ASD groups, respectively. The error bars represent 95% confidence interval. P-values were obtained by linear regression with the measure of functional connectivity (R2) as the response variable and the diagnostic group (TD or ASD) as the predictor variable with age, gender, and site as covariates. All p-values were corrected for multiple tests by FDR. Note that the mean functional connectivity measurement (R2) is significantly lower in the ASD group compared to the TD group, suggesting decreased functional cortico-cerebellar connectivity in the ASD group.

