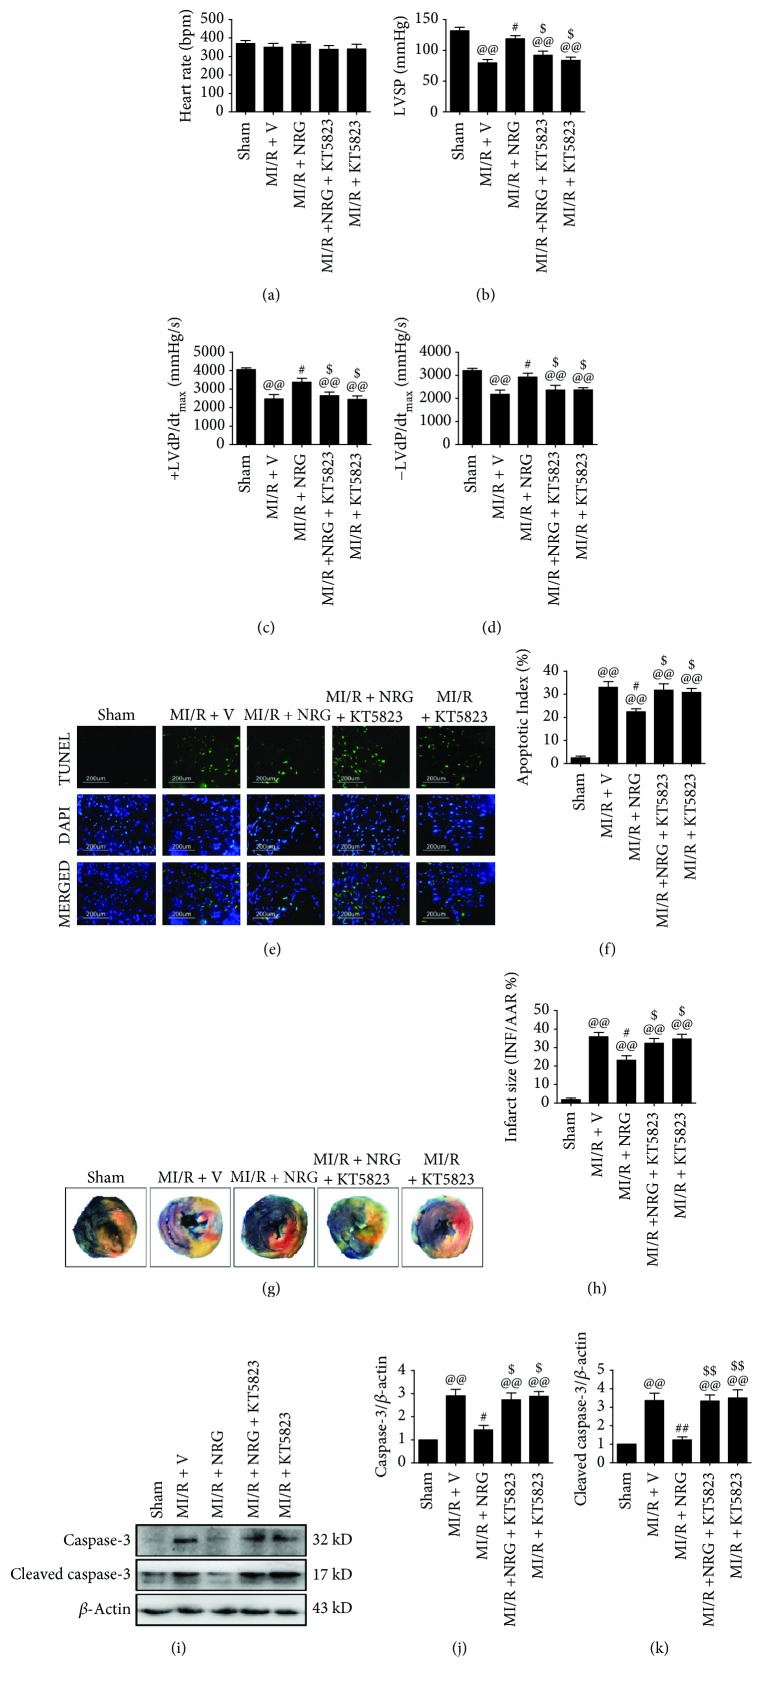
Figure 2.
Evaluation of cardiac function, myocardial apoptosis, and infarction. The animals were given naringenin treatment by oral gavage at a dose of 50 mg/kg/d for 5 days and then subjected to MI/R surgery. KT5823 (2 mg/kg) was intravenously administered to the animals at the beginning of myocardial ischemia. Cardiac function and myocardial apoptosis were measured after 4 hours of reperfusion. Myocardial infarct size was measured after 6 hours of reperfusion. (a) Heart rate (HR). (b) Left ventricular systolic pressure (LVSP). (c, d) The instantaneous first derivative of left ventricular pressure (+dP/dtmax and −dP/dtmax). (e) Representative photomicrographs of TUNEL staining (200x). Green fluorescence shows TUNEL-positive nuclei; blue fluorescence shows nuclei of total cardiomyocytes. (f) Percentage of TUNEL-positive nuclei. (g) Representative photographs of Evan's Blue-TTC staining. (h) Myocardial infarct size expressed as percentage of area-at-risk (AAR). (i) Representative blots. (j) Caspase-3 expression. (k) Cleaved caspase-3 expression. Data are expressed as mean ± SEM. n = 6 per group. @@P < 0.01vs. sham group, #P < 0.05/##P < 0.01vs. MI/R + V group, and $P < 0.05/$$P < 0.01vs. MI/R + NRG group. MI/R: myocardial ischemia-reperfusion; V: vehicle; NRG: naringenin.

