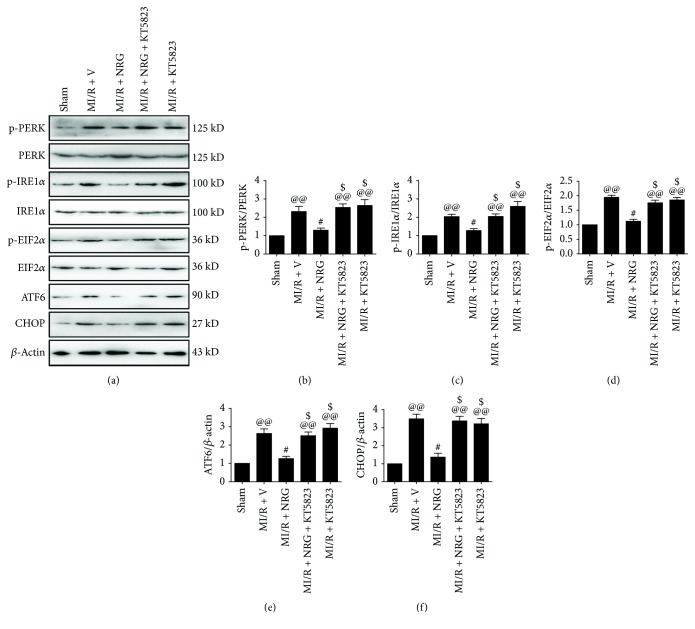
Figure 3.
Evaluation of myocardial endoplasmic reticulum stress level. Western blot analysis was conducted after 4 hours of reperfusion. (a) Representative blots, (b) PERK (Thr980) phosphorylation level, (c) IRE1α (Ser724) phosphorylation level, (d) EIF2α (Ser51) phosphorylation level, (e) ATF6 expression, and (f) CHOP expression. Data are expressed as mean ± SEM. n = 6 per group. @@P < 0.01vs. sham group, #P < 0.05/##P < 0.01vs. MI/R + V group, and$P < 0.05/$$P < 0.01vs. MI/R + NRG group. MI/R: myocardial ischemia-reperfusion; V: vehicle; NRG: naringenin.

