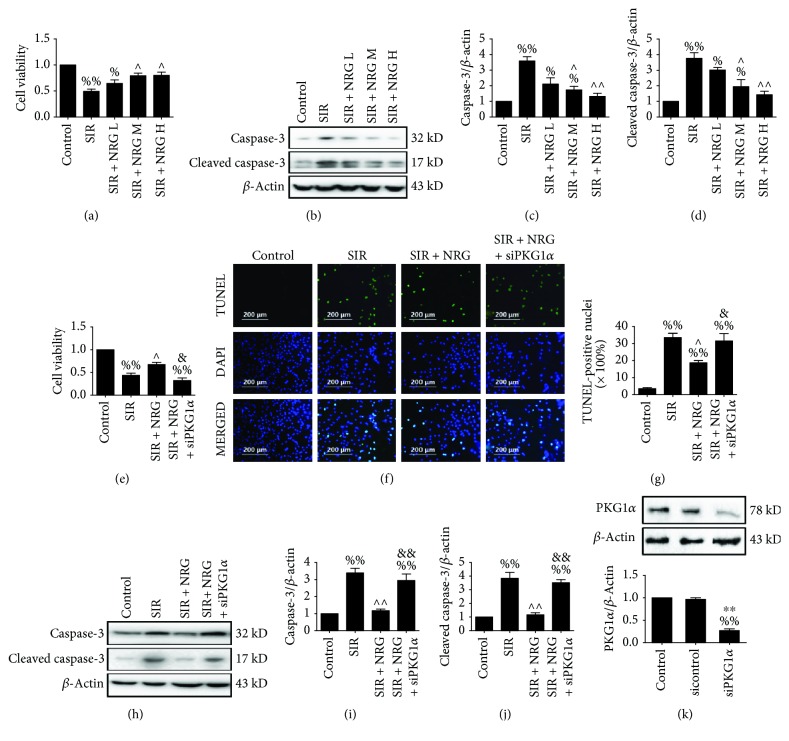
Figure 5.
Evaluation of cell viability and apoptosis. Initially, H9c2 cardiomyoblasts received low (L), medium (M), or high (H) concentrations of naringenin treatment (40, 80, or 160 μmol/L) for 6 hours and subjected to simulated ischemia-reperfusion injury. Cell viability and apoptosis were assessed (a-d). Next, H9c2 cells were transfected with PKGIα siRNA and administered with or without naringenin (80 μmol/L, 6 hours). Then, they emulated ischemia-reperfusion SIR treatment. Cell viability and apoptosis were measured after 4 hours of simulated reperfusion (e-j). (a) Cell viability, (b) representative blots, (c) caspase-3 expression, (d) cleaved caspase-3 expression, (e) cell viability, and (f) representative photomicrographs of TUNEL staining (200x). Green fluorescence shows TUNEL-positive nuclei; blue fluorescence shows nuclei of total cardiomyocytes. (g) Percentage of TUNEL-positive nuclei, (h) representative blots, (i) caspase-3 expression, (j) cleaved caspase-3 expression, (k) the knockdown capacity of PKGIα siRNA were evaluated by Western blotting. Data are expressed as mean ± SEM. n = 6 per group. %P < 0.05/%%P < 0.01vs. control group, ∧P < 0.05/∧∧P < 0.01vs. SIR group, &P < 0.05/&&P < 0.01vs. SIR + NRG group, and ∗∗P < 0.01vs. sicontrol group. SIR: simulated myocardial ischemia-reperfusion; NRG: naringenin.

