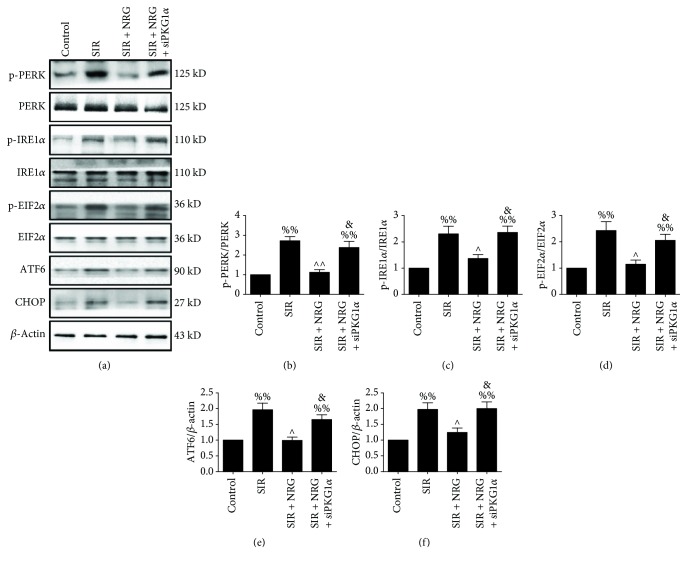
Figure 6.
Evaluation of cellular endoplasmic reticulum stress level. All the measurements were carried out after 4 hours of simulated reperfusion. (a) Representative blots, (b) PERK (Thr980) phosphorylation level, (c) IRE1α (Ser724) phosphorylation level, (d) EIF2α (Ser51) phosphorylation level, (e) ATF6 expression, and (f) CHOP expression. Data are expressed as mean ± SEM. n = 6 per group. %%P < 0.01vs. control group, ∧P < 0.05/∧∧P < 0.01vs. SIR group, and &P < 0.05vs. SIR + NRG group. SIR: simulated myocardial ischemia-reperfusion; NRG: naringenin.

