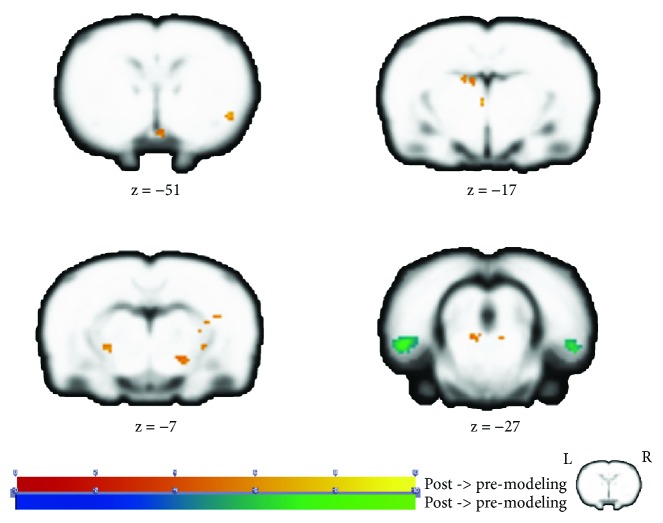
Figure 2.
Group differences of ALFF analysis in resting-state scan. The warm tone represents that the ALFF value of postmodeling was higher than that of premodeling, while the cold tone represents that the ALFF value of postmodeling was lower than that of premodeling. Z-value was the z-axis coordinate along the anterior-posterior axis referenced to a stereotaxic rat brain MRI template [69] which has been aligned with the coordinates of Paxinos and Watson's. ALFF: amplitude of low-frequency fluctuations.

