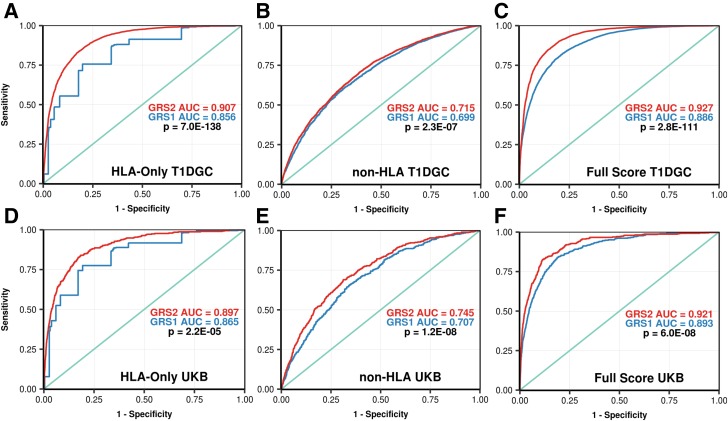
Figure 2.
ROC curves comparing the ability of GRS1 and GRS2, and their components, to discriminate T1D. For each pair of curves in a panel, ROC AUCs are shown as well as the P value for their comparison by the DeLong algorithm. A: HLA DR-DQ haplotypes and interaction terms for GRS1 vs. GRS2 in the T1DGC. B: Both non–DR-DQ HLA and non-HLA loci for GRS1 vs. GRS2 in the T1DGC. C: Full GRS1 vs. full GRS2 in the T1DGC discovery data set. D: HLA DR-DQ haplotypes and interaction terms, for GRS1 vs. GRS2, in the UK Biobank (UKB). E: Both non–DR-DQ HLA and non-HLA loci, for GRS1 vs. GRS2, in UK Biobank. F: Full GRS1 vs. full GRS2 in UK Biobank.

