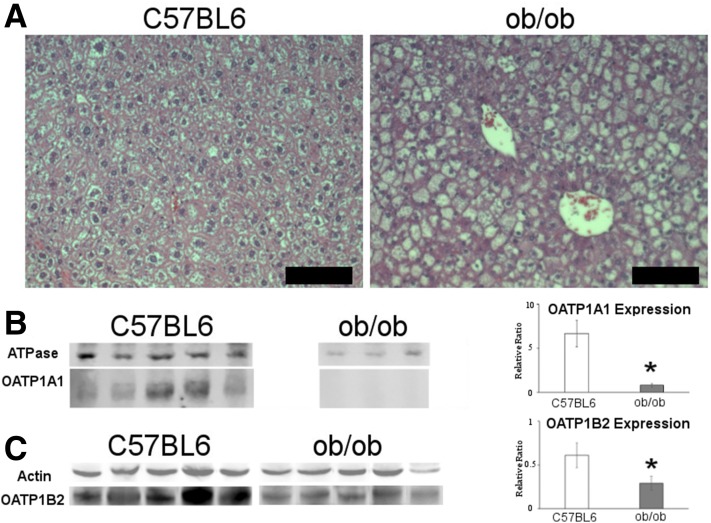
Figure 3.
Characterization of T2D mice using histology and Western blot. A: Representative images of hematoxylin-eosin–stained liver sections for C57BL/6 (left) and ob/ob (right) mice. Scale bars = 50 µm. B: Fluorescent Western blot of C57BL/6 (left) and ob/ob (right) mice with Na+/K+ ATPase and OATP1A1. Graph represents the relative ratio OATP1A1 (Na+/K+ ATPase). C: Fluorescent/chemiluminescent Western blot of C57BL/6 (left) and ob/ob (right) mice with actin and OATP1B2. Graph represents the relative ratio of OATP1B2/(actin). *P < 0.05, within graphs representing statistical significance.

