Figure 1.
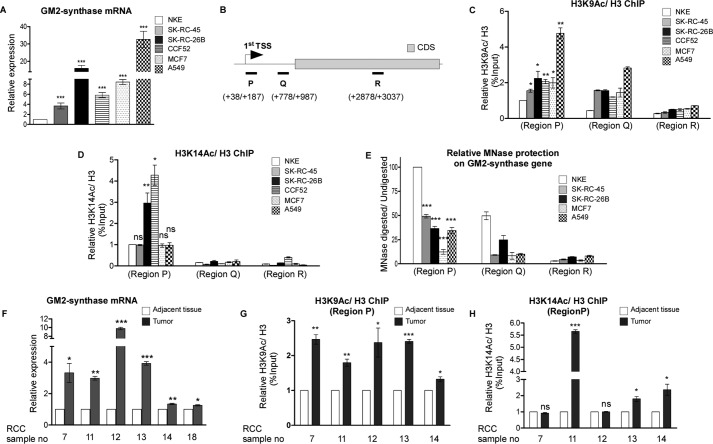
Increased histone acetylations at Region P of GM2-synthase gene associate with higher GM2-synthase mRNA expression in various cancer cell lines and RCC patient tumors. A, GM2-synthase mRNA is over-expressed in cancer cell lines. Total RNA was isolated from indicated cell lines and reverse-transcribed. cDNAs were subjected to qPCR using GM2-synthase primer. Relative expression values were normalized to the GAPDH transcript levels and represented as -fold change with respect to NKE. The data represent three independent determinations (average ± S.E.; Student's t test; ***, p < 0.001). B, schematic representation showing three regions along the GM2-synthase gene, namely Region P (+38/+187), Region Q (+778/+987), and Region R (+2878/+3037). C and D, Region P of GM2-synthase gene in cancer cell lines shows higher histone acetylations. ChIP assay performed with different cell lines using antibodies specific for H3, acetyl-H3K9, and acetyl-H3K14. Precipitated chromatin DNA was estimated by qPCR. The results are expressed as relative -fold change with respect to Region P of GM2-synthase gene in NKE. Error bars represent mean ± S.E. of three independent determinations for Region P; Student's t test; *, p < 0.05; **, p < 0.01 versus NKE cells. E, Region P of GM2-synthase gene in cancer cell lines shows lower MNase protection. The MNase protection for each cell line was determined by normalizing the amount of MNase-digested qPCR product to that of the undigested product by using ΔΔCt method (y axis) and represented as relative -folds with respect to Region P of GM2-synthase gene in NKE with an arbitrary value of 100. Error bars represent mean ± S.E. of five independent determinations; Student's t test; ***, p < 0.001 versus Region P of NKE cells. F, GM2-synthase mRNA is over-expressed in RCC tumors. qPCR performed with GM2-synthase primer followed by normalization with β-tubulin and represented as -fold change with respect to corresponding tumor-adjacent tissue. The data represent three independent determinations (average ± S.E.; Student's t test; *, p < 0.05; **, p < 0.01; ***, p < 0.001). G and H, Region P of GM2-synthase gene in tumor tissues shows higher histone acetylations. ChIP assay performed with human RCC tumor and corresponding tumor-adjacent tissues using antibodies specific for H3, acetyl-H3K9, and acetyl-H3K14. Precipitated DNA was PCR amplified as indicated in C and D. Error bars represent mean ± S.E. of three independent determinations; Student's t test; *, p < 0.05; **, p < 0.01; ***, p < 0.001 versus adjacent tissue. ns, not significant.

