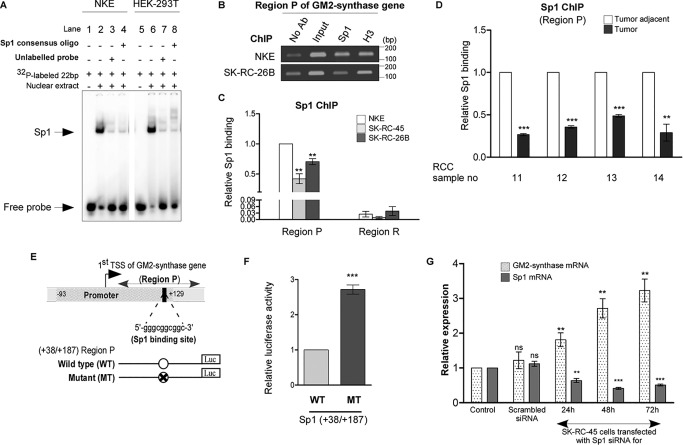
Figure 4.
The Sp1-binding site within Region P of GM2-synthase gene promoter functions as a repressor. A, Sp1 binds with Sp1-binding site within Region P in vitro. EMSA used probes as mentioned in Table S1E with nuclear lysates of NKE and HEK-293T cell lines. Interaction of nuclear protein with the [γ-32P]ATP–labeled probes resulted in significant shift (arrow mark) (lanes 2 and 6) which was self-competed with excess of unlabeled probe (lanes 3 and 7) as well as cross-competed with unlabeled 22-bp Sp1 consensus oligonucleotide (lanes 4 and 8). B, relative high Sp1 binding to Region P in transcriptionally repressed state of GM2-synthase gene in NKE compared with transcriptionally active state in RCC cell lines. ChIP assay was done using antibodies specific for Sp1. ChIP assay with antibody specific for H3 and no antibody served as positive and negative controls, respectively. Representative gel image showing immune-precipitated DNA from indicated cell lines was PCR amplified using primers (150 bp) targeting Region P (bp). C, ChIP assay followed by qPCR showing relative Sp1 binding at Region P in the mentioned cell lines. Region R having no Sp1-binding site was used as a negative control. The data represent three independent determinations (average ± S.E.; Student's t test; **, p < 0.01). D, relative high Sp1 binding to Region P with transcriptionally repressed state of GM2-synthase gene in human RCC tumor-adjacent tissues. ChIP assay followed by qPCR for Sp1 binding at Region P was carried out in the human RCC tumor and corresponding tumor-adjacent tissues. The results are expressed as relative -fold change with respect to Region P of corresponding tumor-adjacent tissues. Error bars represent mean ± S.E. of three independent determinations; Student's t test; **, p < 0.01; ***, p < 0.001. E, map of Region P of GM2-synthase gene used for luciferase reporter assay. Schematic representation of the first TSS of GM2-synthase gene showing the core promoter (region −93/+129) as analyzed using Genomatix PromoterInspector, encompassing the +109/+125 Sp1-binding site. The position of Region P is marked. Map of luciferase constructs with Region P are shown along with mutated Sp1-binding site. F, Sp1-binding site at Region P functions as a repressor site. HEK-293T cells were transiently co-transfected with WT-Sp1 or MT-Sp1 firefly luciferase constructs and pRLCMV plasmid. Protein lysates were prepared for Dual-Luciferase Assay. The data represent three independent determinations (average ± S.E., Student's t test, ***, p < 0.001). G, Sp1 knock down in SK-RC-45 cells increases GM2-synthase transcription. SK-RC-45 cells were transfected with siRNA directed against Sp1 mRNA for indicated time points. Scrambled siRNA treatment was done for 72 h. Total RNA was isolated and reverse-transcribed. cDNAs were subjected to qPCR using GM2-synthase primer. Relative expression values were normalized to the housekeeping gene tubulin transcripts levels and represented as -fold change with respect to nontransfected cells as control. The data represent three independent determinations (average ± S.E.; Student's t test; **, p < 0.01; ***, p < 0.001). ns, not significant.

