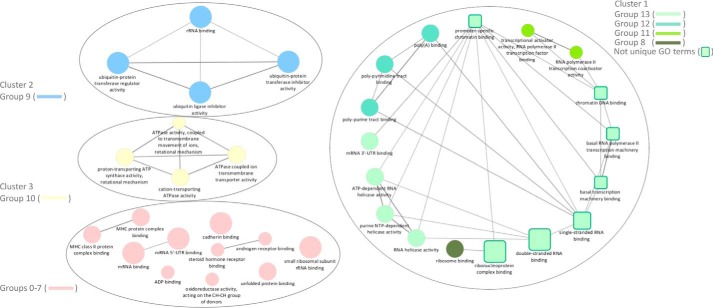
Figure 3.
Functionally grouped network of enriched molecular function categories for the identified proteins generated by using the ClueGO cytoscape plug-in. The proportion of shared proteins between terms was evaluated using kappa statistics. GO terms are represented as nodes whose size represents the term enrichment significance. Partially overlapping functionally related groups are represented as squares, whereas nonoverlapping terms are represented as circles. Clusters including more than two terms are numbered as clusters 1 (green), 2 (blue), and 3 (yellow). The group number resulting from ClueGO associations of GO terms is indicated for each cluster (Table S2). Nonclustered terms including groups 0–7 are colored pink.

