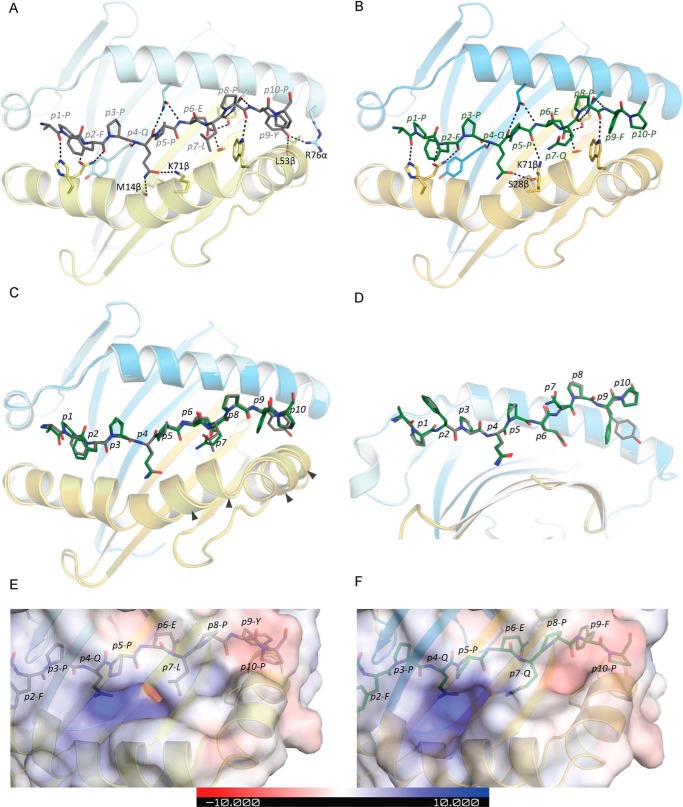
Figure 4.
Structures of HLA-DQ2.5–HLA-DQ2.5-glia-α1a and HLA-DQ2.5–HLA-DQ2-glia-ω1 complexes. HLA-DQ2.5 is shown as cartoon, and peptides are shown as sticks, with HLA-DQ2.5 α-chain in light blue, β-chain in yellow, and DQ2.5-glia-α1a and DQ2.5-glia-ω1 peptides in grayish green, respectively. A, interactions between HLA-DQ2.5 and the DQ2.5-glia-α1a peptide. B, interactions between HLA-DQ2.5 and the DQ2.5-glia-ω1 peptide. C, overlay of HLA-DQ2.5–DQ2.5-glia-α1a and HLA-DQ2.5–DQ2.5-glia-ω1 (top view) showing differences in the HLA-DQ2.5 β-chain helix. The arrowheads show the regions where the helix is shifted by >0.5 Å. D, overlay of HLA-DQ2.5–DQ2.5-glia-α1a and HLA-DQ2.5–DQ2.5-glia-ω1 (side view) showing differences in side-chain conformation in p9. E and F, electrostatic surface potential of HLA-DQ2.5–DQ2.5-glia-α1a (E) and of HLA-DQ2.5–DQ2.5-glia-ω1 (F).

