Figure 2.
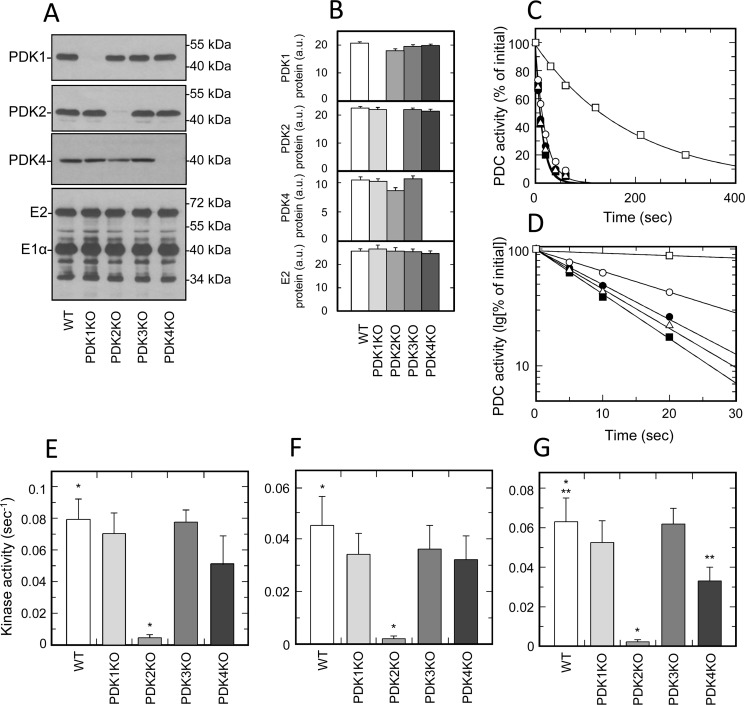
Isozymic composition of PDK and regulation of activity of PDC isolated from tissues of muscle origin. A, representative Western blots illustrating protein levels of PDK1, PDK2, PDK4, and E2 and E1α proteins of PDC in heart muscle. B, relative abundance of PDK1, PDK2, PDK4, and E2 proteins in heart based on the results of scanning densitometry (data points represent means ± S.D. (error bars) for three mice in each group). White, light gray, gray, dark gray, and black bars, samples obtained from WT, PDK1 knockout, PDK2 knockout, PDK3 knockout, and PDK4 knockout mice, respectively. Isolation of PDC and Western blotting were carried out as described under “Experimental procedures.” Each lane contains 14 or 6 μg of partially purified PDC protein for kinase or PDC staining, respectively. C, representative ATP-dependent inactivation curves of partially purified PDC from heart muscle of WT (dark squares), PDK1 knockout (dark circles), PDK2 knockout (open squares), PDK3 knockout (open triangles), and PDK4 knockout mice (open circles), respectively. An ATP-dependent inactivation assay was carried out as described under “Experimental procedures.” Phosphorylation reactions for heart and diaphragm samples received a partially purified PDC–kinase complex at a final concentration of 1.2 mg/ml. Reactions for samples of skeletal muscles contained PDC–kinase complex at 3.0 mg/ml. D, representative ATP-dependent inactivation curves from C replotted in semilogarithmic coordinates. E, F, and G, kinase activity in preparations of partially purified PDC obtained from heart, skeletal muscle, and diaphragm, respectively. White, light gray, gray, dark gray, and black bars, kinase activity in PDC preparations from WT, PDK1 knockout, PDK2 knockout, PDK3 knockout, and PDK4 knockout mice, respectively. As described under “Experimental procedures,” kinase activities are expressed in terms of pseudo-first-order rate inactivation constants (s−1). Data points represent means ± S.D. for 6–10 mice in each group. p < 0.05 compared with WT group is considered statistically significant. Groups showing statistically significant differences are indicated by single (p ≤ 0.05) and double asterisks (p ≤ 0.01).

