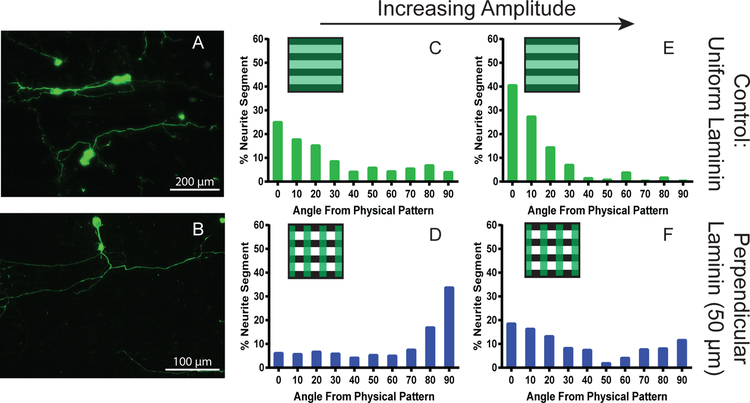
Figure 8:
Quantification of SGN neurites grown on patterned substrates with variable amplitude. Epifluorescent images of neurites grown on (A) uniformly laminin coated 50 μm periodicity and 8 μm amplitude physically patterned and (B) perpendicularly patterned laminin on a 50 μm periodicity and 8 μm amplitude physical pattern. The top row of histograms represents the quantification of SGN neurites seeded on substrates with a uniform coating of laminin and amplitudes of 3 μm (C, n=135) and 8 μm (E, n=158). The bottom row of histograms represents the quantification of SGN neurites seeded on substrates with a 50 μm perpendicular laminin pattern and amplitudes of 3 μm (D, n=175) and 8 μm (F, n=217). The box in the top left corner of each histograms represents the pattern present for the quantification (green stripes for the vertical laminin pattern and black stripes for the horizontal physical pattern). Cultures were stained with anti-NF200 antibodies.

