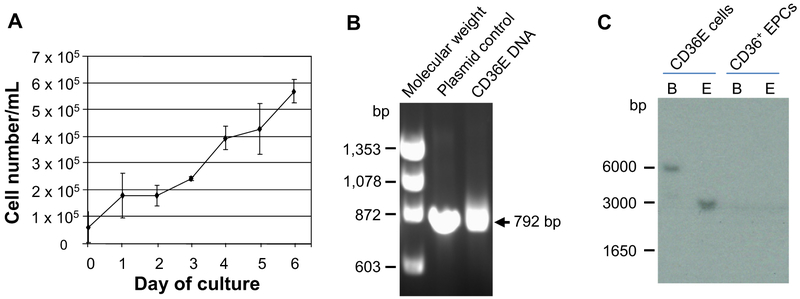
Figure 1.
Growth curve of CD36E cells and detection of HPV16 E6/E7-gene integration in the genomes. (A) CD36E cells were cultured in the serum-free expansion medium. Cell number and viability were assessed by the Trypan blue-dye exclusion. Each value is the mean ± SD of three experiments. (B) Genomic DNA isolated from CD36E cells or CD36+ EPCs was PCR-amplified to examine the integration of HPV16 E6/E7 genes into the genomes using the adequate primer set. An arrow represents a position of the amplified fragment from the HPV16 E6/E7 genes. DNA size markers (bp) are denoted on the left. (C) Genomic DNA isolated from CD36E cells or CD36+ EPCs was digested with BamHI or EcoRI, and subjected to Southern blot analysis. Numbers on the left indicate molecular weight marker positions.

