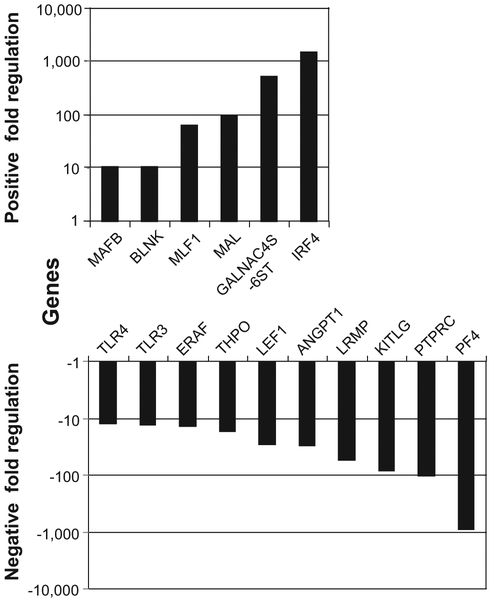
Figure 6.
Gene expression profiling of CD36E cells using the real-time RT-PCR arrays. Total RNA was isolated from CD36E cells using the Qiagen microRNA Extraction kit and converted to complementary DNA, followed by real-time RT-PCR assay using the Custom PCR array targeting hematopoietic genes and the modified-cataloged cytokine array. Fold changes represent ratios of gene expression levels with fivefold or greater differences between the CD36E cells and the parental CD36+ EPCs.

