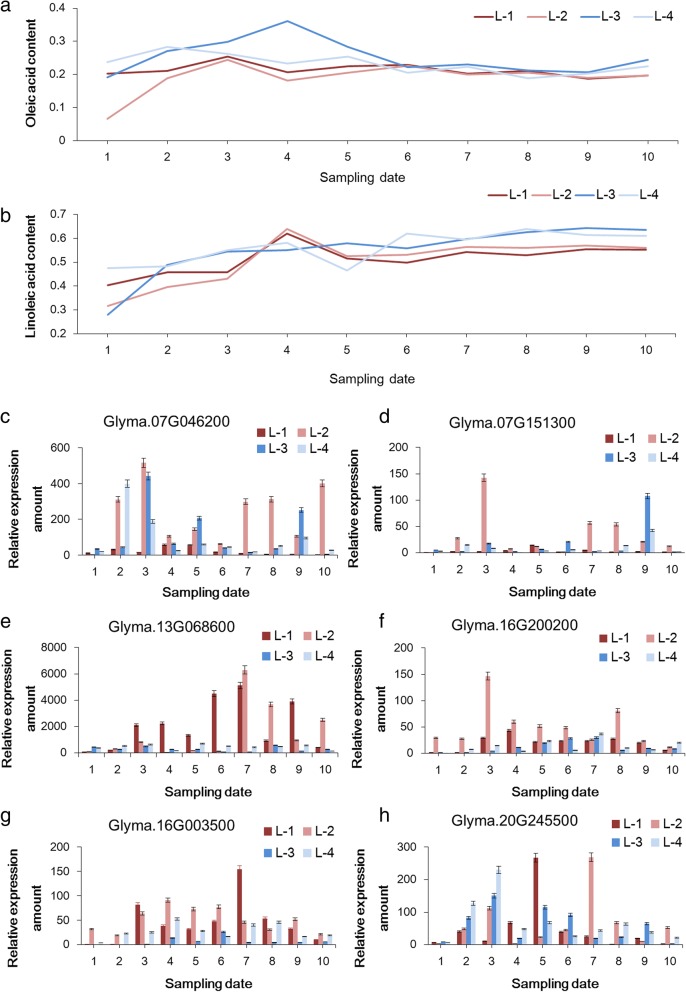
Fig. 4.
The relationship between expression level of candidate genes and oleic acid content as well as linoleic acid content detected during the seed developmental stages in characteristic soybean accessions. a-b: the dynamic oleic- and linoleic- acid content of four characteristic soybean accessions. For the ten sampling points on x axis, 1–4 corresponds with R5 stage, 5–6 corresponds with R6 stage, 7–8 corresponds with R7 stage, 9–10 corresponds with R8 stage. c-h: The relative expression patterns of candidate genes that are possibly responsible for oleic- and/or linoleic- acid content

