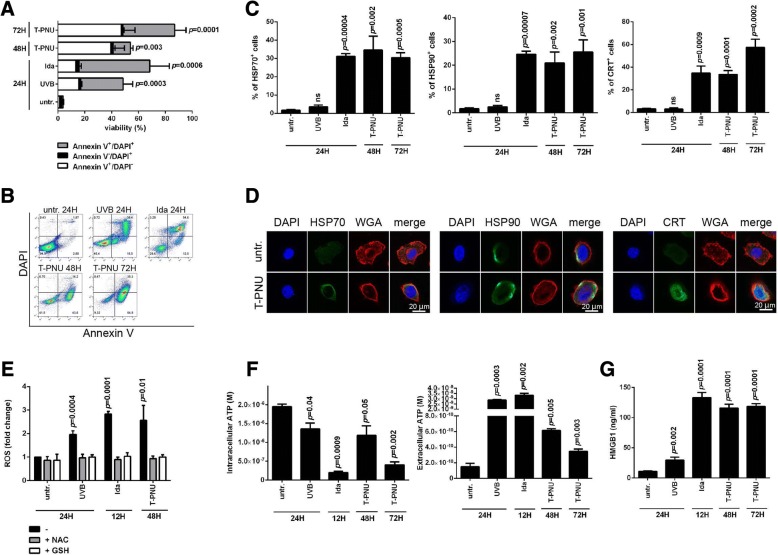
Fig. 2.
T-PNU displays immunogenic cell death properties. a, EMT6-hHER2 cell death kinetics induced by T-PNU. Percentage of early (annexin V+/DAPI−) and late (annexin V+/DAPI+) apoptotic cells and necrotic cells (annexin V−/DAPI+) was determined by flow cytometry. Data presented as mean ± SD for 3 independent experiments. b, Representative dot plots of flow cytometry analysis of cell death induced by T-PNU, idarubicine and UVB radiation at indicated time points. c, T-PNU induction of HSP70, HSP90 and CRT on EMT6-hHER2 cells. UVB treated cells are used as controls. Experiments were performed in triplicates. d, Representative immunofluorescence staining of HSP70, HSP90 and CRT on EMT6-hHER2 following T-PNU treatment. The presence of indicated markers on the cell surface was verified by confocal microscopy. e, T-PNU induces oxidative stress and production of reactive oxygen species (ROS). ROS were stained by CellRox Deep Red reagent and detected by flow cytometry. Experiments were performed in triplicates. f, Quantification of intracellular or extracellular ATP levels in EMT6-hHER2 cell line exposed to T-PNU, idarubicine and UVB. Data presented as mean ± SD for 3 independent experiments. g, HMGB1 release into EMT6-hHER2 culture supernatants induced by T-PNU. The compiled results of a total of 3 experiments are shown

