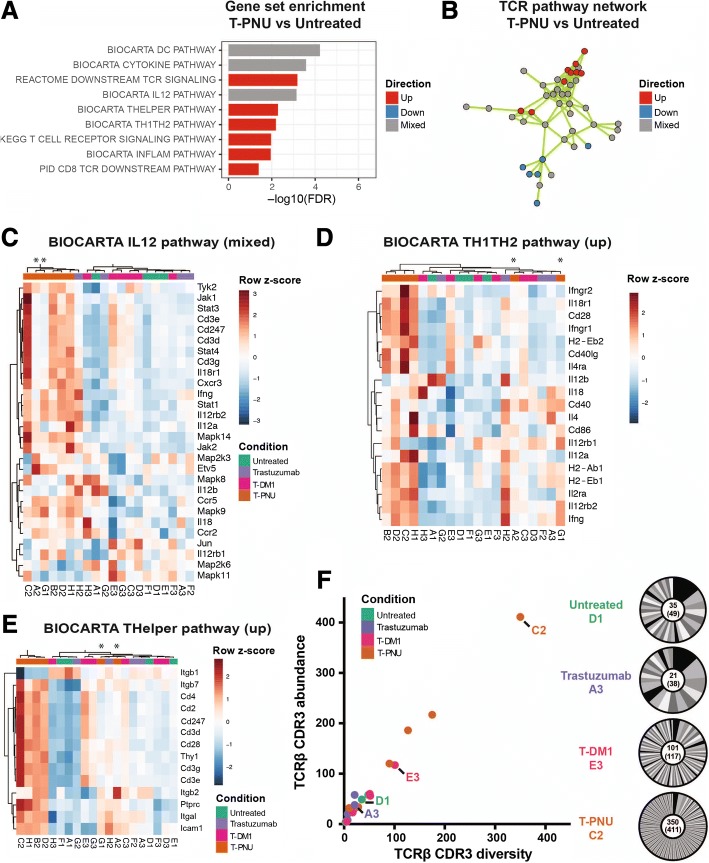
Fig. 4.
The T-PNU anti-tumor response consists of infiltrating and activated T cells. a, Gene set enrichment analysis of gene sets involved in T cell activation. Depicted is T-PNU vs. untreated. FDR: false discovery rate. b, Network cluster of gene sets with overlapping genes with TCR pathway function. The network includes 22 gene sets and 5448 genes (see Additional file 1: Table S1). c-e, Heatmaps of selected BIOCARTA THELPER, IL12 and TH1TH2 pathway gene sets, respectively (see Additional file 1: Figure S5 and S6 for more gene set heatmaps). f, MiXCR TCRβ CDR3 clonotype analysis. TCRβ CDR3 diversity (unique clones) plotted against TCRβ CDR3 abundance (read count). Donut plots depict clonotype distribution for one selected sample per cohort

