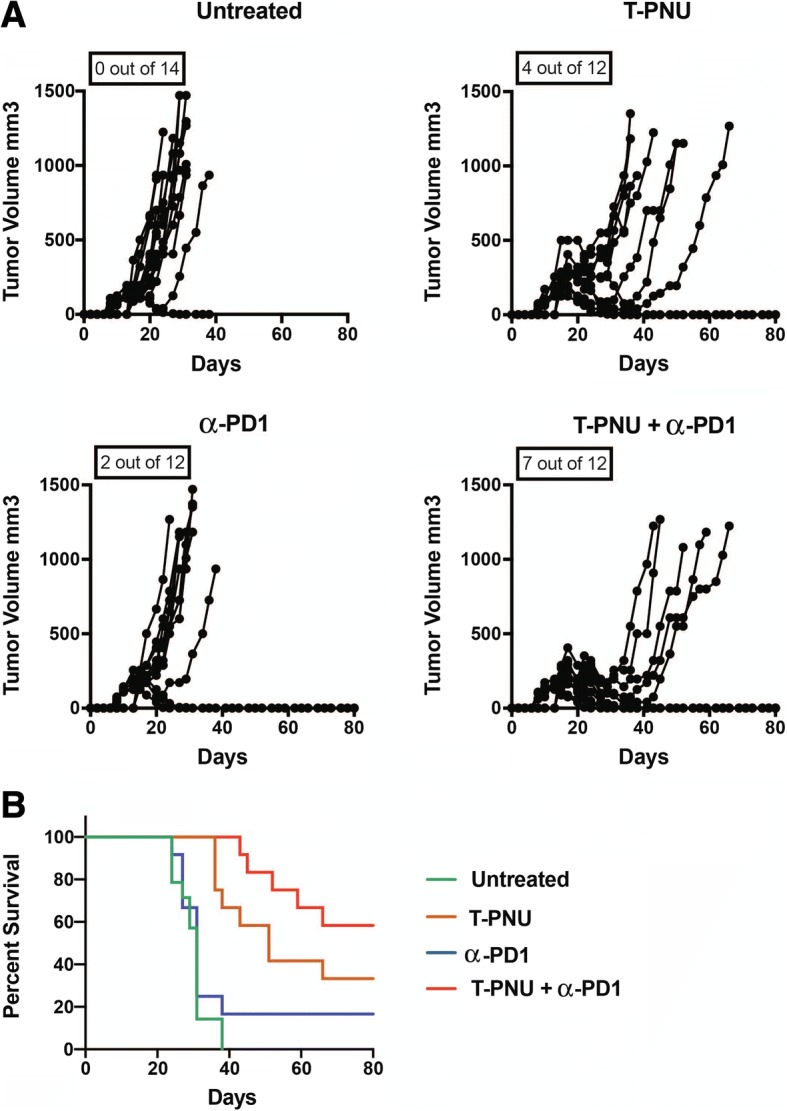
Fig. 7.

T-PNU treatment in combination with checkpoint inhibitor therapy. a, Therapeutic response of EMT6-hHER2 animals with a tumor volume of 150–200 mm3 following treatment with T-PNU (1 mg/kg, 2x) alone, α-PD1 alone (12.5 mg/kg) or their combination (T-PNU + α-PD1) p-value< 0.0001*** (Gehan-Breslow-Wilcoxon Test) in between all the survival curves. b, Survival curves of a
