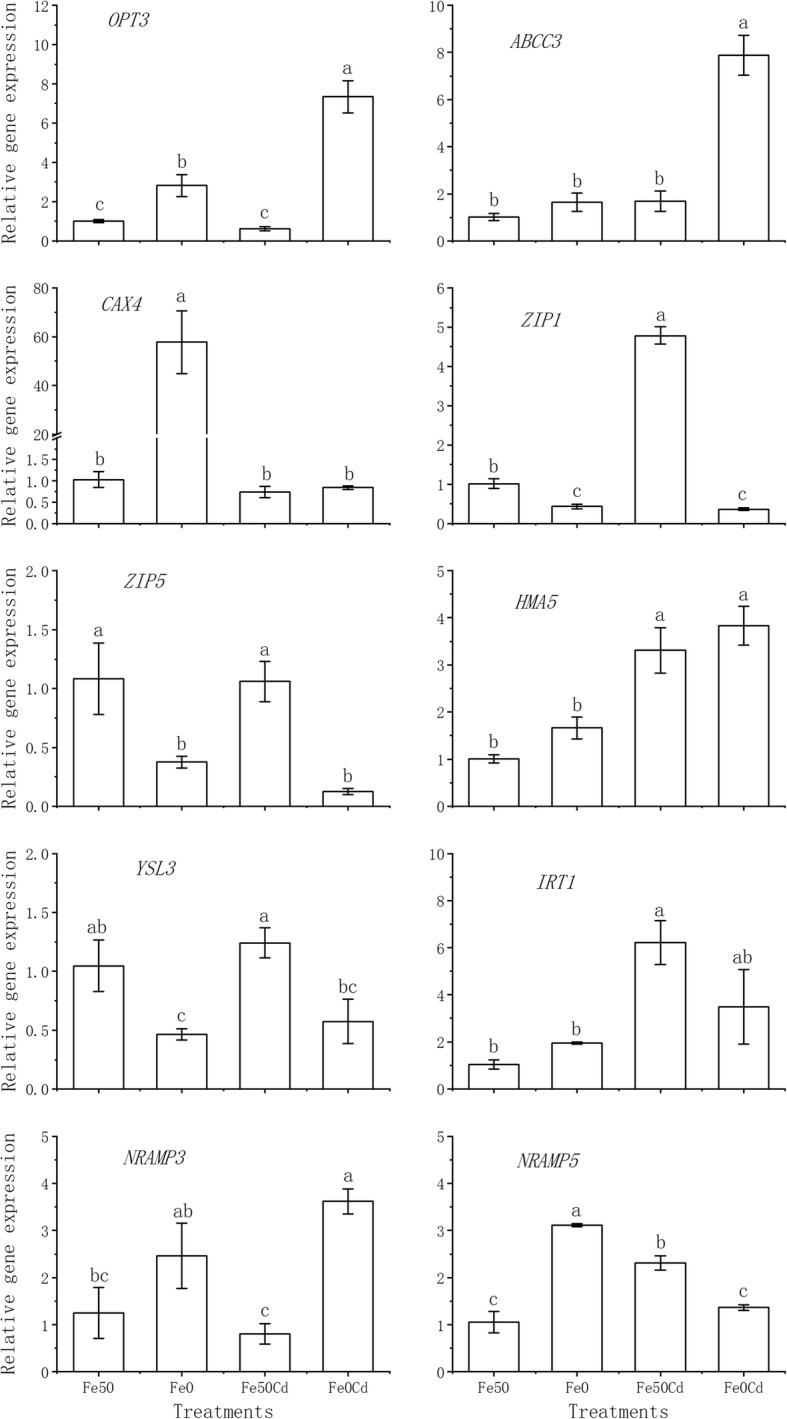
Fig. 5.

The qRT-PCR analysis of metal transport-related genes in peanut roots exposed to 0 or 2 μM Cd under Fe-sufficient (Fe50) and Fe-deficient (Fe0) conditions. The relative expression of each gene was calculated as the 2−ΔΔCT value and normalized by geometric mean of three stably expressed reference genes. Data are presented as means with SE (n = 3). Different letters above error bars indicate that values are significantly different (P < 0.05) according to Duncan’s multiple range test after one-way analysis of variance
