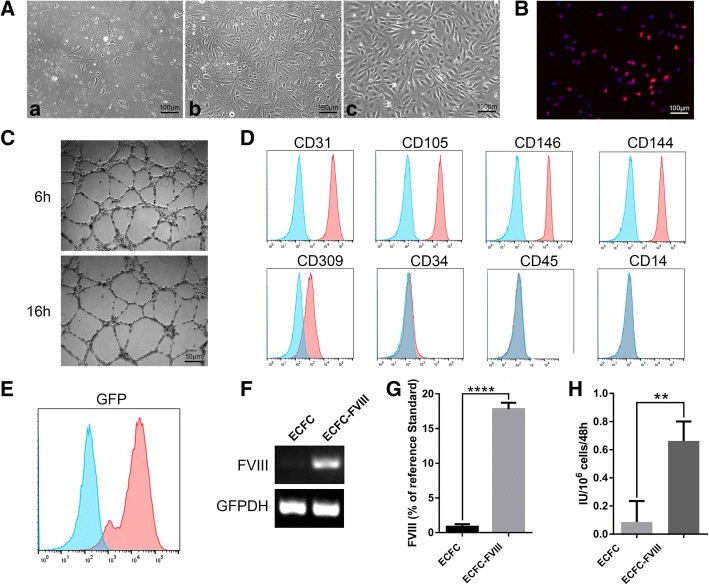
Fig. 1.
Characterization of cord blood-derived ECFCs before and after transduction. (A) Representative phase contrast images of isolated mononuclear cells from cord blood at day 3 (panel a) and day 7 (panel b) of in vitro culture. Typical cobblestone-like morphology of ECFCs at passage 6 is shown in (panel c). (B) Acetylated low-density lipoprotein uptake by ECFCs. (C) Tube formation by ECFCs on Matrigel. (D, E) Flow cytometric analyses of ECFC immunophenotype of surface markers (D) and GFP (E) expression after transduction (n = 1). Blue lines showed the negative controls, red lines showed positive expressions respectively. (F) Transduced and non-transduced ECFCs were characterized for BDD-FVIII gene expression by RT-PCR. (G) FVIII secretion detected by ELISA and (H) FVIII activity detected by chromogenic assay of ECFC culture media. Data are expressed as mean ± SD. ****p < 0.0001, **p < 0.01, n = 3

