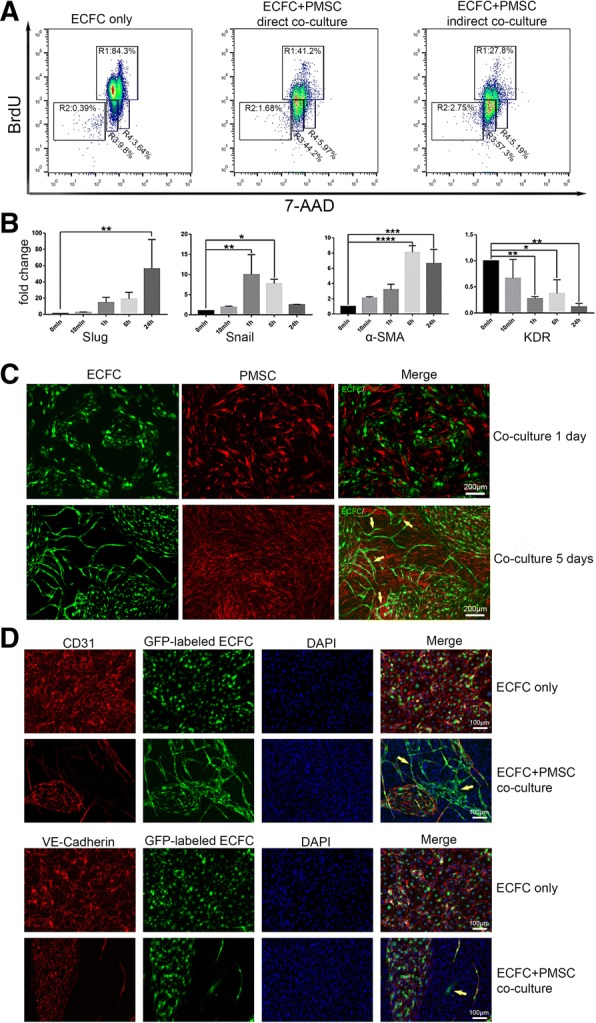
Fig. 6.

EndMT induced by co-culture ECFCs with PMSCs. a Cell cycle analysis by flow cytometry of ECFCs direct or indirect co-cultured with PMSCs. R1: S phase, R2: apoptotic, R3: G0/G1 phase, R4: G2+M phase. b Real-time PCR of EndMT-related gene. Data are expressed as mean ± SD. ***p < 0.001, **p < 0.01, *p < 0.05, n = 3. c Cell phenotype of co-cultured ECFCs and PMSCs. d Immunocytochemistry staining image of 5 days co-cultured ECFCs and PMSCs
