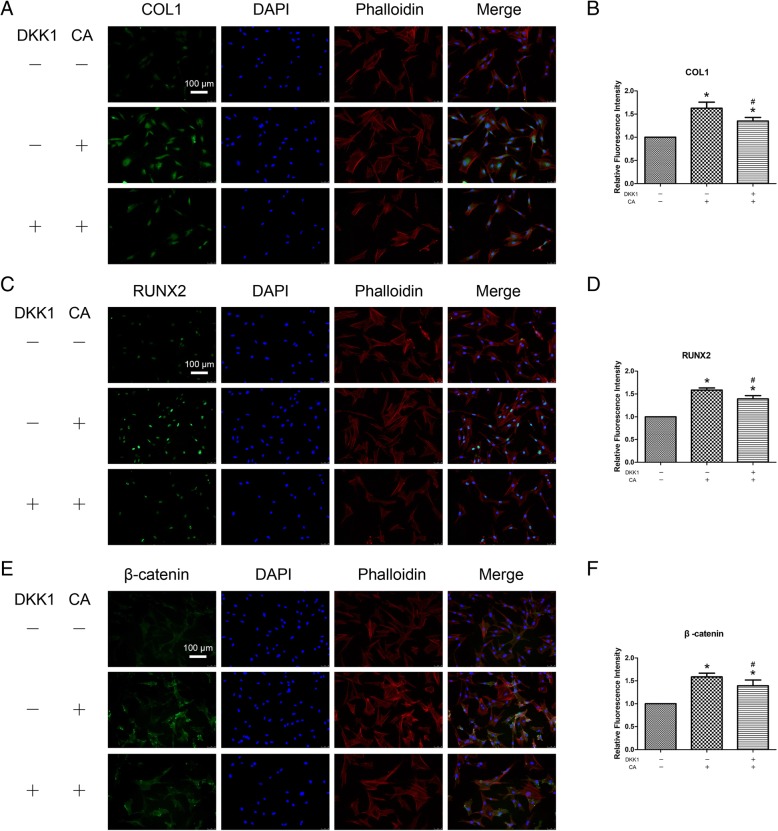
Fig. 4.
Immunofluorescence staining shows the protein levels of COL1 (a, b), RUNX2 (c, d) and β-catenin (e, f) with the administration of DKK1. The data were confirmed by three repeated tests. The data are presented as the means ± SD. CA, catalpol. *P < 0.05 compared with the control group, #P < 0.05 compared with the catalpol treatment group

