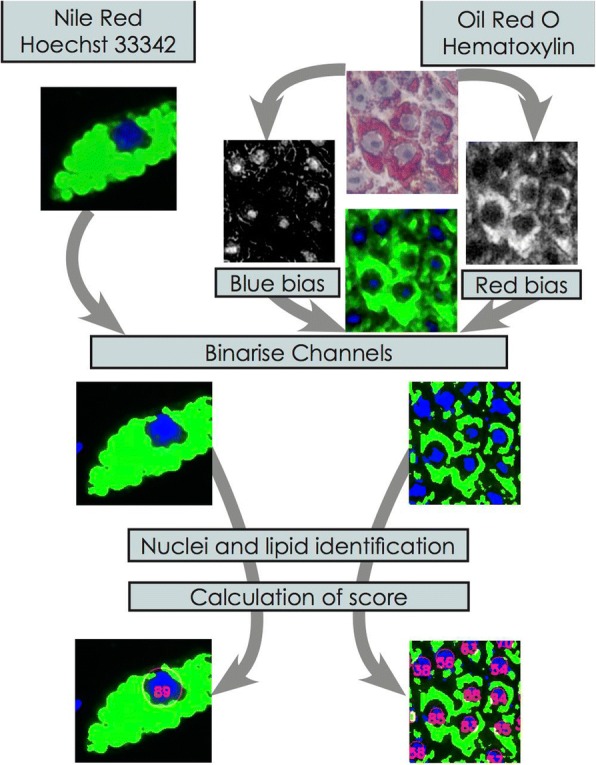
Fig. 1.

Flow chart of the FATS algorithm. The nuclei channel (blue) and the lipid channel (green) are generated from either the fluorescence or the colour images by calculation of the blue and red bias in the colour channels. The resulting two-channel image is then binarised, the nuclei identified, and the lipid scores calculated
